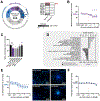
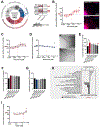
. 2025 Apr:198:109400.
doi: 10.1016/j.envint.2025.109400. Epub 2025 Mar 20.

Nuclear hormone receptors control fundamental processes of human fetal neurodevelopment: Basis for endocrine disruption assessment

Affiliations

Nuclear hormone receptors control fundamental processes of human fetal neurodevelopment: Basis for endocrine disruption assessment

Katharina Koch et al. Environ Int. 2025 Apr.

Abstract

Despite growing awareness of endocrine disrupting chemicals (EDCs), knowledge gaps remain regarding their effects on human brain development. EDC risk assessment focuses primarily on EATS modalities (estrogens, androgens, thyroid hormones, and steroidogenesis), overlooking the broader range of hormone receptors expressed in the developing brain. This limits the evaluation of chemicals for their potential to cause endocrine disruption-mediated developmental neurotoxicity (ED-DNT). The Neurosphere Assay, an in vitro test method for developmental neurotoxicity (DNT) evaluation, is an integral component of the DNT in vitro testing battery, which has been used to screen a broad domain of environmental chemicals. Here, we define the endocrine-related applicability domain of the Neurosphere Assay by assessing the impact and specificity of 14 hormone receptors on seven key neurodevelopmental processes (KNDPs), neural progenitor cell (NPC) proliferation, migration of radial glia, neurons, and oligodendrocytes, neurite outgrowth, and differentiation of neurons and oligodendrocytes. Comparative analyses in human and rat NPCs of both sexes revealed species- and sex-specific responses. Mechanistic insights were obtained through RNA sequencing and agonist/antagonist co-exposures. Most receptor agonists modulated KNDPs at concentrations in the range of physiologically relevant hormone concentrations. Phenotypic effects induced by glucocorticoid receptor (GR), liver X receptor (LXR), peroxisome proliferator-activated receptor beta/delta (PPARβδ), retinoic acid receptor (RAR) and retinoid X receptor (RXR) activation were counteracted by receptor antagonists, confirming specificity. Transcriptomics highlighted receptor crosstalk and the involvement of conserved developmental pathways (e.g. Notch and Wnt). Species comparisons identified limited concordance in hormone receptor-regulated KNDPs between human and rat NPCs. This study presents novel findings on cellular and molecular hormone actions in human fetal NPCs, highlights major species differences, and illustrates the Neurosphere Assay's relevance for detecting endocrine MoAs, supporting its application in human-based ED-DNT risk assessment.

Keywords: Developmental neurotoxicity; EDC; Endocrine disruption; Neural progenitor cells; Neurons; New approach methodologies; Oligodendrocytes.


Conflict of interest statement

Declaration of competing interest The authors declare the following financial interests/personal relationships which may be considered as potential competing interests: Katharina Koch reports financial support was provided by European Commission. Ellen Fritsche reports financial support was provided by European Commission. Joerdis Klose reports financial support was provided by FOKO (Forschungskommision of the medical faculty of the Heinrich-Heine-University). Ellen Fritsche reports financial support was provided by FOKO (Forschungskommision of the medical faculty of the Heinrich-Heine-University). Arif Doenmez reports financial support was provided by European Commission. Stefan Masjosthusmann reports financial support was provided by German Ministry of Education and Research (BMBF). Katharina Koch reports a relationship with DNTOX GmbH that includes: employment and equity or stocks. Joerdis Klose reports a relationship with DNTOX GmbH that includes: employment and equity or stocks. Arif Doenmez reports a relationship with DNTOX GmbH that includes: employment and equity or stocks. Ellen Fritsche reports a relationship with DNTOX GmbH that includes: employment and equity or stocks. The data for this manuscript was generated solely at the IUF prior to the foundation of the DNTOX GmbH. The funders of DNTOX had no role in the design of the study, in the collection, analyses, or interpretation of data, in the writing of the manuscript, or in the decision to publish the results. If there are other authors, they declare that they have no known competing financial interests or personal relationships that could have appeared to influence the work reported in this paper.

Figures
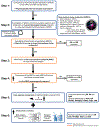
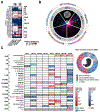
Fig. 1.
Fig. 1.. Overview of the study design.
Schematic representation of the six-phase study design. (1) Hormone receptor expression in human NPCs was compared to fetal cortical tissue to confirm the model’s physiological relevance. (2) Receptor agonist and antagonist (except PGE2R and VDR) effects on seven KNDPs were assessed in the Neurosphere Assay using male and female NPCs. AR/ER agonism showed no effect. (3) The most sensitive endpoint (MSE) was identified for receptor agonism (except AR/ER). (4) MSE physiological relevance was assessed by comparing benchmark concentrations (BMCs) with fetal cord blood hormone levels, leading to the exclusion of PGE2R and VDR. (5) Species-specific differences were investigated by comparing receptor expression and exposing rat NPCs to receptor agonists. Proliferating rat NPCs were exposed to GR and RAR agonists, while differentiating rat NPCs were exposed to AhR, LXR, PPARs, PR, RXR, and THR agonists. (6) For hormone receptor agonists affecting KNDPs at physiologically relevant concentrations, mechanistic studies were conducted using RNA sequencing and coexposure experiments with the respective receptor antagonists.
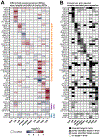
Fig. 2.
Fig. 2.. Hormone receptor expression and phenotypic effects of receptor modulation in human NPCs.
A. Hormone receptor expression in human fetal cortical tissue (hCTX, GW8, 12, and 16) and proliferating (hNPC Prol) and 60 h-differentiated (hNPC Diff) human fetal NPCs (GW16), presented as log2 RPKM (hCTX) and log2 FPKM (hNPC) values. B. Overview of Neurosphere Assay endpoints. C. Summary of receptor agonist (bold) and antagonist (italics) effects on KNDPs modelled in the Neurosphere Assay (NPC1–5), expressed as BMCs (μM). Only effects at non-cytotoxic concentrations are shown. The most sensitive endpoint (MSE) for receptor activation is highlighted in orange; for AhR and RXR, no clear MSE could be defined. # effects reaching the BMR limit but not significant according to the prediction model. Created with biorender.com. (For interpretation of the references to color in this figure legend, the reader is referred to the web version of this article.)
Fig. 3.
Fig. 3.. Species-specific effects of neurodevelopmental hormone receptor regulation in human and rat NPCs.
A. Hormone receptor expression in proliferating (rNPC Prol) and 72 h-differentiated rat NPCs (rNPC 72 h Diff) compared with proliferating (hNPC Prol) and 60 h-differentiated (hNPC 60 h Diff) human NPCs. B. Representative immunocytochemical stainings of 5 day-differentiated human and rat NPCs. Neurons were stained with β(III)tubulin, oligodendrocytes with O4 and nuclei with Hoechst 33258. C. Proliferating rat NPCs were exposed to GR and RAR agonists or solvent (0.1 % DMSO) for 3 days before BrdU incorporation was measured. Differentiating rat NPCs were exposed to AhR, LXR, PPAR, PR, RXR, and THR agonists or solvent (0.1 % DMSO) for 5 days before neuronal (NPC3) and oligodendrocyte (NPC5) differentiation was measured. Receptor agonist effects in rat NPCs were compared to MSEs derived for human NPCs, expressed as BMCs (μM). Only effects at non-cytotoxic concentrations are shown. AR, ER, PGE2R and VDR activation was not assessed in rat NPCs. Created with biorender.com.
Fig. 4.
Fig. 4.. Transcriptomic analysis of hormone receptor target genes regulation in human NPCs.
A. Proliferating (GR and RAR) and differentiating (AhR, LXR, PPAR, PR, RXR, and THR) human NPCs were exposed to receptor agonists for 60 h (BMC30 of MSE) before total RNA was extracted and subjected to RNA sequencing. Genes with a |log2(FC)| > 0.486 and q < 0.05 were defined as DEGs. Presented are genes within all DEGs identified as receptor targets based on a non-systematic literature search. B. Literature evidence for hormone receptor-dependent gene regulation (PubMed) distinguishing receptor targets (i) in brain tissue or neuronal cultures (black), (ii) in non-brain tissue or non-neuronal cultures (dark gray), and (iii) genes without evidence of hormone receptor dependency in the literature but in the present study (light gray). Genes with no evidence of hormone receptor-mediated regulation in the brain in the literature or in the present study are highlighted in white. Lists of all DEGs and full reference list are provided in Sup. Data 13 and 14. Created with biorender.com.
Fig. 5.
Fig. 5.. The glucocorticoid receptor regulates human NPC proliferation and differentiation in a sex-specific manner.
A. GR-sensitive KNDPs (color) and respective BMCs (μM) derived from Fig. 2C. B. Proliferating human NPCs were exposed to the GR agonist dexamethasone (DEX) or solvent (0.1 % DMSO) for 3 days before the proliferative capacity was assessed. Data were stratified by genetic sex. C. Male proliferating human NPCs were exposed to solvent (0.2 % DMSO), 60 nM DEX (BMC30), or DEX in combination with the GR antagonist mifepristone (MP, 0.01 – 10 μM) for 3 days before the proliferative capacity was assessed. *Significant (p < 0.05, two-tailed Student t-test) compared to the solvent control. #Significant (p < 0.05, Dunnett and Tamhane) compared to 60 nM DEX. D. Top ten GO terms with the most upregulated (light gray) and downregulated (dark gray) DEGs in proliferating human NPCs exposed to 60 nM DEX (BMC30) for 60 h. Significant enrichment of DEGs in GO terms was defined by p < 0.01 (purple star). DEGs in GO terms are provided in Sup. Data 15. E-G. Differentiating male and female human NPCs were exposed to solvent (0.1 % DMSO) and either DEX (E) or the GR-specific antagonist AL082D06 (F + G) for 5 days before neuronal differentiation (E + F) or oligodendrocyte differentiation (G) was assessed. For B, E, F and G: *significant (p < 0.05, Dunnett and Tamhane) compared to the lowest concentration. Data (B, C, E-G) are expressed as mean ± SEM. Created with biorender.com. (For interpretation of the references to color in this figure legend, the reader is referred to the web version of this article.)
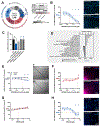
Fig. 6.
Fig. 6.. The liver X receptor controls multiple KNDPs, including differentiation of neurons and oligodendrocytes and radial glia migration.
A. LXR-sensitive KNDPs (color) and respective BMCs (μM) derived from Fig. 2C. B. Differentiating human NPCs were exposed to the LXR agonist GW3965 (GW39) or solvent (0.1 % DMSO) for 5 days before oligodendrocyte differentiation was assessed. C. Differentiating human NPCs were exposed to solvent (0.2 % DMSO), 37 nM GW39 (BMC30), or GW39 in combination with the LXR antagonist SR9238 (SR92, 0.002 – 0.2 μM) for 5 days before oligodendrocyte differentiation was assessed. *Significant (p < 0.05, two-tailed Student t-test) compared to solvent control (SC). #Significant (p < 0.05, Dunnett and Tamhane) compared to 37 nM GW39. D. Top ten GO terms with the most upregulated (light gray) and downregulated (dark gray) DEGs in differentiating human NPCs exposed to 37 nM GW39 (BMC30) for 60 h. Significant enrichment of DEGs in GO terms was defined by p < 0.01 (blue star). DEGs in GO terms are provided in Sup. Data 15. E. Differentiating human NPCs were exposed to GW39 or solvent (0.1 % DMSO) for 5 days before assessing radial glia migration. Data were stratified by genetic sex. F-H. Differentiating human NPCs were exposed to solvent (0.1 % DMSO) and either GW39 (F) or SR92 (G + H) for 5 days before neuronal differentiation (F), the mean neurite area (G), or oligodendrocyte differentiation (H) was assessed. For B, E-H: *significant (p < 0.05, Dunnett and Tamhane) compared to the lowest concentration. Data (B, C, E-H) are expressed as mean ± SEM. Created with biorender.com. (For interpretation of the references to color in this figure legend, the reader is referred to the web version of this article.)
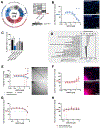
Fig. 7.
Fig. 7.. PPARβδ activity affects human NPC lineage specification, resembling LXR and RXR effects.
A. PPARβδ-sensitive KNDPs (color) and respective BMCs (μM) derived from Fig. 2C. B. Differentiating human NPCs were exposed to the PPARβδ agonist GW0742 or solvent (0.1 % DMSO) for 5 days before oligodendrocyte differentiation was assessed. C. Differentiating human NPCs were exposed to solvent (0.2 % DMSO), 621 nM GW0742 (BMC30), or GW0742 in combination with the PPARβδ antagonist GSK3787 (GSK, 0.01 – 1 μM) for 5 days before oligodendrocyte differentiation was assessed. *Significant (p < 0.05, two-tailed Student t-test) compared to the solvent control. #Significant (p < 0.05, Dunnett and Tamhane) compared to 621 nM GW0742. D. Top ten GO terms with the most upregulated (light gray) and downregulated (dark gray) DEGs in differentiating human NPCs exposed to 621 nM GW0742 (BMC30) for 60 h. Significant enrichment of DEGs in GO terms was defined by p < 0.01 (blue star). DEGs in GO terms are provided in Sup. Data 15. E. Differentiating human NPCs were exposed to GW0742 or solvent (0.1 % DMSO) for 5 days before the migration of radial glia, neurons and oligodendrocytes was assessed. F-H. Differentiating human NPCs were exposed to solvent (0.1 % DMSO) and either GW0742 (F + G) or GSK (H) for 5 days before neuronal differentiation (F), the mean neurite area (G + H), or total subneurite length (H) were assessed. For B, E-H: *significant (p < 0.05, Dunnett and Tamhane) compared to the lowest concentration. Data (B, C, E-H) are expressed as mean ± SEM. Created with biorender.com. (For interpretation of the references to color in this figure legend, the reader is referred to the web version of this article.)
Fig. 8.
Fig. 8.. The retinoic acid receptor regulates human NPC proliferation and oligodendrocyte differentiation.
A. RAR-sensitive KNDPs (color) and respective BMCs (μM) derived from Fig. 2C. B. Proliferating human NPCs were exposed to the RAR agonist all-trans retinoic acid (atRA) or solvent (0.1 % DMSO) for 3 days before the proliferative capacity was assessed. C. Proliferating human NPCs were exposed to solvent (0.2 % DMSO), 90 nM atRA (BMC30), or atRA in combination with the RAR antagonist AGN193109 (AGN, 0.01–10 μM) for 3 days before the proliferative capacity was assessed. *Significant (p < 0.05, two-tailed Student t-test) compared to the solvent control. #Significant (p < 0.05, Dunnett and Tamhane) compared to 90 nM atRA. D. Top ten GO terms with the most upregulated (light gray) and downregulated (dark gray) DEGs in proliferating human NPCs exposed to 90 nM atRA (BMC30) for 60 h. Significant enrichment of DEGs in GO terms was defined by p < 0.01 (purple star). DEGs in GO terms are provided in Sup. Data 15. E + F. Differentiating human NPCs were exposed to atRA for five days before oligodendrocyte differentiation (E) and radial glia migration (F) were assessed. Representative pictures show the differentiated sphere including a closeup of the migration area for (E). For B, E and F: *significant (p < 0.05, Dunnett and Tamhane) compared to the lowest concentration. Data (B, C, E and F) are expressed as mean ± SEM. Created with biorender.com. (For interpretation of the references to color in this figure legend, the reader is referred to the web version of this article.)
Fig. 9.
Fig. 9.. Retinoid X receptor signaling promotes neurogenesis and exhibits transcriptomic similarities to LXR activation.
A. RXR-sensitive KNDPs (color) and respective BMCs (μM) derived from Fig. 2C. B-D. Differentiating human NPCs were exposed to the RXR agonist bexarotene (BEXA) or solvent (0.1 % DMSO) for 5 days before neuronal differentiation (B), the mean neurite area (C), and radial glia migration (D) was assessed. E-G. Differentiating human NPCs were exposed to solvent (0.2 % DMSO), 30 nM BEXA (BMC30), or BEXA in combination with the RXR antagonist HX531 (HX, 0.001 – 1 μM) for 5 days before neuronal differentiation (E), the mean neurite area (F) and radial glia migration (G) were assessed. *Significant (p < 0.05, two-tailed Student t-test) compared to the solvent control (SC). #Significant (p < 0.05, Dunnett and Tamhane) compared to 30 nM BEXA. H. Top ten GO terms with the most upregulated (light gray) and downregulated (dark gray) DEGs in differentiating human NPCs exposed to 30 nM BEXA (BMC30) for 60 h. Significant enrichment of DEGs in GO terms was defined by p < 0.01 (red star). DEGs in GO terms are provided in Sup. Data 15. I. Differentiating human NPCs were exposed to HX531 or solvent (0.1 % DMSO) for 5 days before the mean neurite area was assessed. For B, C, D, and I: *Significant (p < 0.05, Dunnett and Tamhane) compared to the lowest concentration. Data (B-G, I) are expressed as mean ± SEM. Created with biorender.com. (For interpretation of the references to color in this figure legend, the reader is referred to the web version of this article.)
Fig. 10.
Fig. 10.. Overview of putative mechanisms underlying hormone receptor regulation of KNDPs.
Receptors promoting specific KNDPs are highlighted in red, whereas those suppressing KNDPs are shown in blue. The size of the receptor icon represents sensitivity (lowest BMC) of the KNDP to activation of the respective receptor. Created with biorender.com. (For interpretation of the references to color in this figure legend, the reader is referred to the web version of this article.)

References

    1. Aleshin S, Reiser G, 2013. Role of the peroxisome proliferator-activated receptors (PPAR)-α, β/δ and γ triad in regulation of reactive oxygen species signaling in brain. Biol. Chem 394, 1553–1570. 10.1515/hsz-2013-0215. - DOI - PubMed
    1. Alnoud MAH, Chen W, Liu N, Zhu W, Qiao J, Chang S, Wu Y, Wang S, Yang Y, Sun Q, Kang J, 2021. Sirt7-p21 Signaling Pathway Mediates Glucocorticoid-Induced Inhibition of Mouse Neural Stem Cell Proliferation. Neurotox. Res 39, 444–455. 10.1007/s12640-020-00294-x. - DOI - PubMed
    1. Anacker C, Cattaneo A, Luoni A, Musaelyan K, Zunszain PA, Milanesi E, Rybka J, Berry A, Cirulli F, Thuret S, Price J, Riva MA, Gennarelli M, Pariante CM, 2013. Glucocorticoid-Related Molecular Signaling Pathways Regulating Hippocampal Neurogenesis. Neuropsychopharmacology 38, 872–883. 10.1038/npp.2012.253. - DOI - PMC - PubMed
    1. Annunziata P, Federico A, D’Amore I, Corona RM, Guazzi GC, 1983. Impairment of human brain development: glycoconjugate and lipid changes in congenital athyroidism. Early Hum. Dev 8, 269–278. 10.1016/0378-3782(83)90009-9. - DOI - PubMed
    1. Araki A, Mitsui T, Goudarzi H, Nakajima T, Miyashita C, Itoh S, Sasaki S, Cho K, Moriya K, Shinohara N, Nonomura K, Kishi R, 2017. Prenatal di(2-ethylhexyl) phthalate exposure and disruption of adrenal androgens and glucocorticoids levels in cord blood: The Hokkaido Study. Sci. Total Environ 581–582, 297–304. 10.1016/J.SCITOTENV.2016.12.124. - DOI - PubMed

Further reading

    1. Anderson H, Fogel N, Grebe SK, Singh RJ, Taylor RL, Dunaif, 2010. Infants of women with polycystic ovary syndrome have lower cord blood androstenedione and estradiol levels. J. Clin. Endocrinol. Metab 95, 2180–2186. 10.1210/jc.2009-2651. - DOI - PMC - PubMed

Substances

LinkOut - more resources