. 2025 Apr 9;5(4):100819.
doi: 10.1016/j.xgen.2025.100819. Epub 2025 Mar 26.

Conservation of dichromatin organization along regional centromeres

Affiliations

Conservation of dichromatin organization along regional centromeres

Danilo Dubocanin et al. Cell Genom. .

Abstract

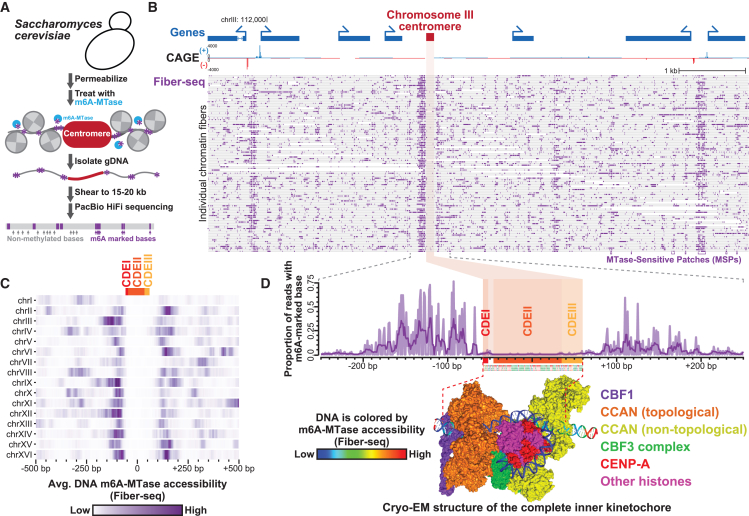
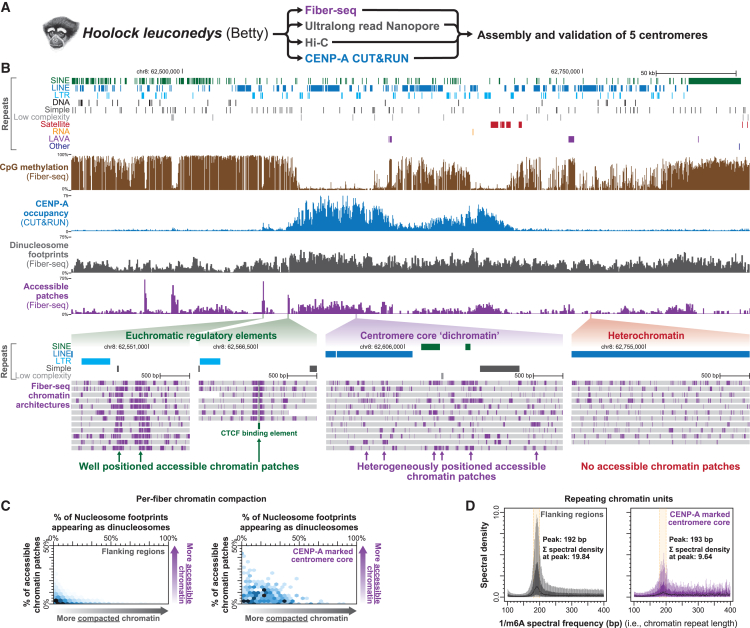
The attachment of the kinetochore to the centromere is essential for genome maintenance, yet the highly repetitive nature of satellite regional centromeres limits our understanding of their chromatin organization. We demonstrate that single-molecule chromatin fiber sequencing (Fiber-seq) can uniquely co-resolve kinetochore and surrounding chromatin architectures along point centromeres, revealing largely homogeneous single-molecule kinetochore occupancy. In contrast, the application of Fiber-seq to regional centromeres exposed marked per-molecule heterogeneity in their chromatin organization. Regional centromere cores uniquely contain a dichotomous chromatin organization (dichromatin) composed of compacted nucleosome arrays punctuated with highly accessible chromatin patches. CENP-B occupancy phases dichromatin to the underlying alpha-satellite repeat within centromere cores but is not necessary for dichromatin formation. Centromere core dichromatin is conserved between humans and primates, including along regional centromeres lacking satellite repeats. Overall, the chromatin organization of regional centromeres is defined by marked per-molecule heterogeneity, buffering kinetochore attachment against sequence and structural variability within regional centromeres.

Keywords: Alpha-satellite; CENP-B; Fiber-seq; centromere; chromatin; kinetochore; single molecule.


Conflict of interest statement

Declaration of interests A.B.S. is a co-inventor on a patent relating to the Fiber-seq method. E.E.E. is a scientific advisory board member of Variant Bio.

Figures

None
Graphical abstract
Figure 1
Figure 1
Resolution of kinetochore and surrounding chromatin architectures along point centromeres (A) Schematic for mapping the chromatin occupancy of point centromeres within the yeast S. cerevisiae using Fiber-seq. (B) Locus displaying single-molecule chromatin architectures of the S. cerevisiae chromosome III point centromere, alongside Cap Analysis of Gene Expression (CAGE) sequencing data and gene annotations. Each gray bar is a single Fiber-seq read, with purple dashes representing sites of m6A-modified bases along that read. Note the large patches of chromatin accessibility that correspond to CAGE-positive gene promoters as well as those immediately adjacent to the centromere. (C) Heatmap displaying average Fiber-seq m6A signal surrounding each of the S. cerevisiae point centromeres. (D) (Top) Zoom-in of the per-nucleotide Fiber-seq signal of the S. cerevisiae chromosome III point centromere in relation to the CDEI, CDEII, and CDEIII elements. (Bottom) Cryo-EM structure of the yeast complete S. cerevisiae inner kinetochore bound to the chromosome III point centromere (PDB: 8OW130), with the DNA colored according to the m6A-MTase sensitivity measured via Fiber-seq on S. cerevisiae.
Figure 2
Figure 2
Dichotomous accessible chromatin patches mark human CHM13 centromere cores (A) Genomic locus of chromosome 5 centromere showing satellite repeats, bulk CpG methylation, Fiber-seq-identified di-nucleosome footprint density, Fiber-seq-identified accessible chromatin patch density, and the density of Fiber-seq inferred regulatory elements (FIREs). Fiber-seq tracks generated by aggregating single-molecule data at each base along the genome. On the bottom are individual Fiber-seq reads (gray bars) with m6A-modified bases in purple delineating single-molecule chromatin architectures within euchromatic and heterochromatic regions. (B) Average density of di-nucleosome footprints and accessible chromatin patches within various genomic regions (∗p < 0.01 Mann-Whitney). (C) Hexbin plot showing the single-molecule density of di-nucleosome footprints and accessible chromatin patches within various genomic regions. (D) Swarm and box-and-whisker plots showing the observed distance between accessible chromatin patches along the same molecule of DNA within the centromere core, as well as the expected distance based on the overall density of accessible chromatin patches within each chromosome’s centromere core (∗p < 0.01 Mann-Whitney). (E) Estimated total number of accessible chromatin patches along each chromosome’s centromere core versus the length of that chromosome. Chromosomes with high rates of missegregation are in red. See also Figure S1 and Table S1.
Figure 3
Figure 3
Centromere core chromatin mirrors the alpha-satellite DNA repeat (A) Box-and-whisker plots of the chromatin repeat lengths from various genomic regions. Specifically, m6A-marked chromatin features from individual chromatin fibers were subjected to Fourier transform, and the per-molecule spectral densities were then aggregated across different fibers from the same genomic region. (B) Heatmap of the median spectral density for various chromatin repeat lengths and the peak chromatin repeat length(s) from fibers contained within the euchromatic genome or various satellite repeat regions. The satellite DNA repeat unit for each region is also indicated. (C) Plot showing the average distance between CENP-B boxes along each centromere core within CHM13 cells alongside a heatmap of the median spectral density for the centromere core and euchromatic regions along each centromere. See also Figure S2.
Figure 4
Figure 4
CENP-B selectively occupies and phases dichromatin within the centromere core (A) Genomic locus showing bulk CpG methylation and per-molecule m6A-marked chromatin architectures and CpG methylations demonstrating single-molecule footprints at centromere core CENP-B boxes. (B) Structure of CENP-B bound to a CENP-B box (PDB: 1HLV53), as well as in vitro DNaseI footprint of a CENP-B-occupied CENP-B box relative to aggregate m6A methylation profile at centromere core CENP-B boxes containing various levels of methylated CpGs (mCpGs). (C) Box-and-whisker plots of footprint scores at CENP-B boxes within various satellite regions as a function of mCpG status at the CENP-B box. Higher scores quantitatively indicate greater CENP-B occupancy (∗p < 0.01 Mann-Whitney). (D) Average density of di-nucleosome footprints and accessible chromatin patches within various genomic regions along the Y chromosome from HG002 using Fiber-seq data from the GM24385 cell line. (E) Heatmap of the median spectral density for centromere core and euchromatic regions along the Y chromosome from HG002 using Fiber-seq data from the GM24385 cell line. See also Figure S3.
Figure 5
Figure 5
Dichromatin is a conserved feature of centromere core chromatin in humans (A and B) Genomic locus showing chromosome 5 centromere in both CHM13 (A) and CHM1 (B) cells, including CpG methylation and accessible chromatin patches. (Bottom) Single-molecule chromatin architecture along individual alpha-satellite repeats within centromere core and non-core alpha-satellite repeats. (C) Hexbin plot showing the single-molecule density of di-nucleosome footprints and accessible chromatin patches within various CHM1 centromere cores and surrounding regions. See also Figure S4.
Figure 6
Figure 6
Centromere core dichromatin architecture does not require alpha-satellite repeats (A) Schematic for Fiber-seq in a lymphoblastoid cell line from the eastern hoolock gibbon (Hoolock leuconedys) Betty. Ultralong-read Nanopore sequencing was used for de novo genome assembly, which was validated using the contigs assembled using Fiber-seq data. CENP-A CUT&RUN was used to identify centromere cores along validated assembly regions. (B) Genomic locus showing chromosome 8 centromere, including different repeat classes, CpG methylation, CENP-A CUT&RUN, and Fiber-seq-derived di-nucleosome footprint density, and chromatin accessibility. (Bottom) Single-molecule chromatin architecture from pericentromeric gene-regulatory elements, centromere core, and heterochromatin. (C) Hexbin plot showing the single-molecule density of di-nucleosome footprints and accessible chromatin patches within centromere core and flanking regions. (D) Box-and-whisker plots of the chromatin repeat lengths from centromere core and flanking regions. On the bottom the peak chromatin repeat unit as well as the medial spectral density at that repeat unit are indicated, showing that chromatin is more disorganized within the centromere core. See also Figure S5.

References

    1. Rosenberg H., Singer M., Rosenberg M. Highly reiterated sequences of SIMIANSIMIANSIMIANSIMIANSIMIAN. Science. 1978;200:394–402. - PubMed
    1. Altemose N., Logsdon G.A., Bzikadze A.V., Sidhwani P., Langley S.A., Caldas G.V., Hoyt S.J., Uralsky L., Ryabov F.D., Shew C.J., et al. Complete genomic and epigenetic maps of human centromeres. Science. 2022;376 doi: 10.1126/SCIENCE.ABL4178. - DOI - PMC - PubMed
    1. Muro Y., Masumoto H., Yoda K., Nozaki N., Ohashi M., Okazaki T. Centromere protein B assembles human centromeric α-satellite DNA at the 17-bp sequence, CENP-B box. J. Cell Biol. 1992;116:585–596. - PMC - PubMed
    1. Masumoto H., Masukata H., Muro Y., Nozaki N., Okazaki T. A human centromere antigen (CENP-B) interacts with a short specific sequence in alphoid DNA, a human centromeric satellite. J. Cell Biol. 1989;109:1963–1973. - PMC - PubMed
    1. Palmer D.K., O’Day K., Trong H.L., Charbonneau H., Margolis R.L. Purification of the centromere-specific protein CENP-A and demonstration that it is a distinctive histone. Proc. Natl. Acad. Sci. USA. 1991;88:3734–3738. - PMC - PubMed

LinkOut - more resources