. 2025 Apr 15;6(4):102029.
doi: 10.1016/j.xcrm.2025.102029. Epub 2025 Mar 26.

A patient-derived T cell lymphoma biorepository uncovers pathogenetic mechanisms and host-related therapeutic vulnerabilities

Danilo Fiore  1 Luca Vincenzo Cappelli  2 Liu Zhaoqi  3 Nikita Kotlov  4 Maria Sorokina  4 Jude Phillip  5 Paul Zumbo  6 Liron Yoffe  7 Paola Ghione  8 Anqi Wang  9 Xueshuai Han  3 Abigail Taylor  10 William Chiu  10 Valentina Fragliasso  11 Fabrizio Tabbo  12 Nahuel Zamponi  13 Nicolás Di Siervi  13 Clarisse Kayembe  10 Giovanni Medico  10 Ruchi P Patel  14 Marcello Gaudiano  10 Rodolfo Machiorlatti  15 Giuseppina Astone  10 Maria Teresa Cacciapuoti  10 Giorgia Zanetti  10 Claudia Pignataro  16 Ruiz Arvin Eric  10 Sanjay Patel  10 Francesca Zammarchi  17 Claudio Zanettini  10 Lucio Queiroz  10 Anastasia Nikitina  4 Olga Kudryashova  4 Anton Karelin  4 Daniil Nikitin  4 Dmitry Tychinin  4 Ekaterina Postovalova  4 Alexander Bagaev  4 Viktor Svekolkin  4 Ekaterina Belova  4 Katerina Tikhonova  4 Sandrine Degryse  4 Chengqi Xu  18 Domenico Novero  19 Maurilio Ponzoni  20 Enrico Tiacci  21 Brunangelo Falini  21 Joo Song  22 Inna Khodos  23 Elisa De Stanchina  23 Gabriele Macari  24 Luciana Cafforio  24 Simone Gardini  24 Roberto Piva  25 Enzo Medico  26 Samuel Y Ng  27 Allison Moskowitz  8 Zachary Epstein  8 Andrew Intlekofer  8 Dogan Ahmed  28 Wing C Chan  22 Peter Martin  29 Jia Ruan  29 Francesco Bertoni  30 Robin Foà  31 Joshua D Brody  32 David M Weinstock  33 Jaspreet Osan  34 Laura Santambrogio  34 Oliver Elemento  18 Doron Betel  35 Wayne Tam  36 Marco Ruella  37 Leandro Cerchietti  13 Raul Rabadan  9 Steven Horwitz  8 Giorgio Inghirami  38
Affiliations

A patient-derived T cell lymphoma biorepository uncovers pathogenetic mechanisms and host-related therapeutic vulnerabilities

Danilo Fiore et al. Cell Rep Med. .

Abstract

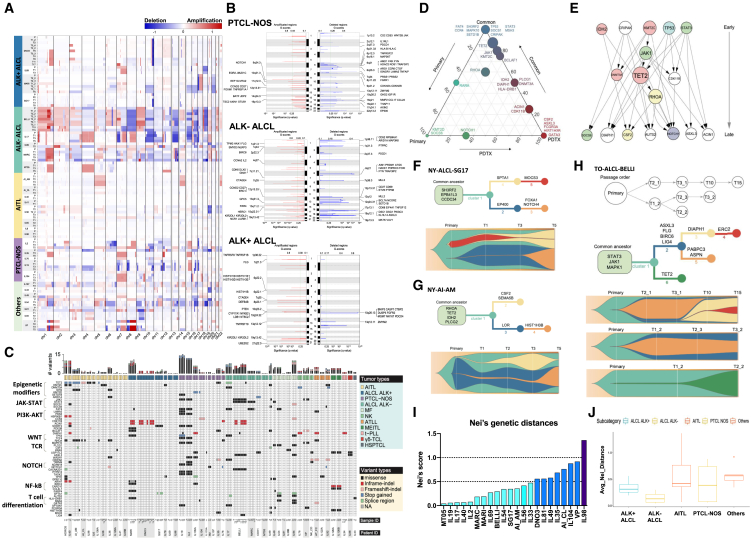
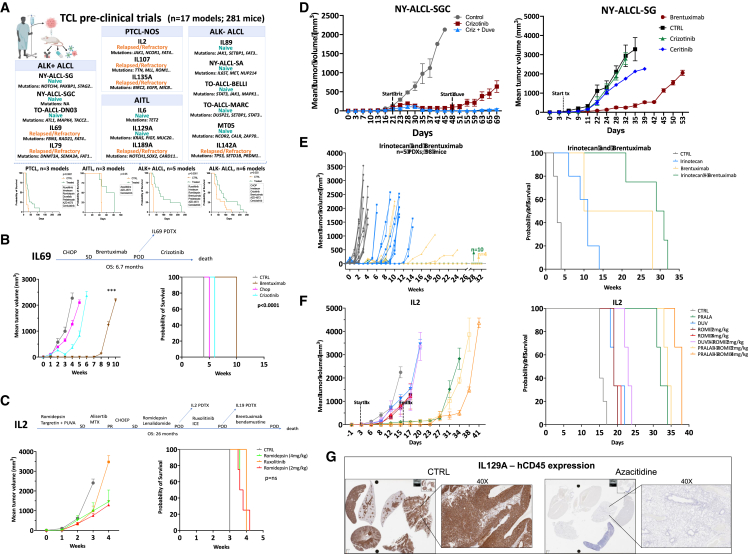
Peripheral T cell lymphomas (PTCLs) comprise heterogeneous malignancies with limited therapeutic options. To uncover targetable vulnerabilities, we generate a collection of PTCL patient-derived tumor xenografts (PDXs) retaining histomorphology and molecular donor-tumor features over serial xenografting. PDX demonstrates remarkable heterogeneity, complex intratumor architecture, and stepwise trajectories mimicking primary evolutions. Combining functional transcriptional stratification and multiparametric imaging, we identify four distinct PTCL microenvironment subtypes with prognostic value. Mechanistically, we discover a subset of PTCLs expressing Epstein-Barr virus-specific T cell receptors and uncover the capacity of cancer-associated fibroblasts of counteracting treatments. PDXs' pre-clinical testing captures individual vulnerabilities, mirrors donor patients' clinical responses, and defines effective patient-tailored treatments. Ultimately, we assess the efficacy of CD5KO- and CD30- Chimeric Antigen Receptor T Cells (CD5KO-CART and CD30_CART, respectively), demonstrating their therapeutic potential and the synergistic role of immune checkpoint inhibitors for PTCL treatment. This repository represents a resource for discovering and validating intrinsic and extrinsic factors and improving the selection of drugs/combinations and immune-based therapies.

Keywords: CAR-T; T cell lymphoma; clonal evolution; drug screenings; microenvironment; patient-derived tumor xenografts; pre-clinical trials; precision medicine; repository; stratification.


Conflict of interest statement

Declaration of interests D.M.W. is an employee of Merck and has an equity interest in Ajax, Bantam, and Travera. F.B. receives institutional research funds from ADC Therapeutics, Bayer AG, Cellestia, Helsinn, HTG Molecular Diagnostics, ImmunoGen, iOnctura, Menarini Ricerche, NEOMED Therapeutics 1, Nordic Nanovector ASA, and Spexis AG; advisory board fees from Novartis; consultancy fee from Helsinn and Menarini; and travel grants from Amgen, AstraZeneca, and iOnctura and provided expert statements to HTG Molecular Diagnostics.

Figures

None
Graphical abstract
Figure 1
Figure 1
Generation of PTCL PDX and PDX derivates (A) Schematic representation of PDX generation and propagation strategies. Different primary sample sources and routes of implantation are annotated. (B) Pie chart indicating the PTCL total and subtype-specific number of PDXs generated. (C) PTCL PDX subtype-specific percentage of engraftment. (D) Number of PDXs generated from naive or refractory patients for different PTCL subtypes. (E) Time of engraftment (in days) of PDXs belonging to different PTCL subcategories along different rounds of propagation (T1 to T10). Error bars represent standard deviations. (F) Representative MRI scanning of 4 different organs (lung, kidney, liver, and spleen) of an NSG mouse implanted with the different PDX. Arrows indicate lymphoma infiltration. (G) Representative H&E staining of 4 different organs (lung, kidney, liver, and spleen) of NSG mice implanted with the AITL PDX model (magnification ×40). (H) Flow cytometric analysis of EBV+ AITL PDX IL129A before (upper panels) and after CD19-ADC treatment (lower panels). (I) Schematic representation of PDX-Dline generation strategies.
Figure 2
Figure 2
PDX faithfully mimics matched primary donor samples (A) H&E staining of primary lymphomas (green frames) and matched PDX (yellow frames, magnification 40×). (B) EBV in situ hybridization depicting EBV+ lymphoblastoid cells (EBER+) in AITL PDX. (C) Multiparametric in situ imaging (MISI) of representative AITL lesions derived from diagnostic (lymph node) and patient-matched PDX (lung). (D) Pie graph reporting the expression of 26 immune-histochemistry (IHC) markers in primary and PDX (T1 to T16) samples. Red: highly expressed, green: low expressed. (E) α/β TCR clonal representation of primary and PDX, along serial passages. (F) EBV positivity among PTCLs. (G) TCR repertoire against EBV peptides and their mismatched sequences compare to known reference sequences. (H) Prediction binding of EBV peptides to MHC class II determinants. (I) In vitro competitive binding assay of EBV tetramers to recombinant DRB1.
Figure 3
Figure 3
PDX maintains the inter- and intratumoral heterogeneity of matched lymphoma (A) PCA of PDX and primary lymphoma-matched samples (AITL, PTCL-NOS, and ALCL) based on the bulk RNA expression levels excluding non-lymphoma reads in primary samples. (B) Heatmap and unsupervised hierarchical clustering based on 1,000 top differentially expressed genes of PDX and primary lymphomas belonging to the main 4 PTCL subcategories (AITL, PTCL-NOS, ALK+ ALCL, and ALK- ALCL). (C) Supervised hierarchical clustering of primary and PDX based on 12 known publicly available signatures stratifying different PTCL entities (A: PMC2817630_AITL, B: PMC2817630_ATLL, C; PMC4014836_TBX21/GATA3, D: PMC20159827_ALK+, E: PMC2817630_ALK+, F: PMC4014836_ALK+/−, G: PMC4014836_AITL, H: PMC4014836_ATLL, I; PMC4014836_ATLL, J: PMC2817630_CT_PTCL, K; PMC6161771_DUSP22, and L: PMC4014836_ENKTL). (D) Uniform manifold approximation and projection (UMAP) clusters annotation based on single-cell RNA-seq expression of PTCL-NOS and AITL (IL-2 and IL138A) and ALCL (IL69, IL79 and IL89) PDX. (E) Dot plot representation of top gene transcripts in each UMAP cluster of the PDX models sequenced by single-cell RNA-seq. (F) UMAP cluster annotation based on single-cell RNA-seq expression (IL138A primary and T3 PDX model). Cell types have been annotated on the right part of the graph. (G) Hallmark analysis of selected differentially expressed pathways among three tumor clusters of IL138A primary and PDX, based on single-cell RNA-seq expression data. Cluster 0 was present in both primary and PDX, while clusters 1 and 2 were enriched in IL138A PDX vs. the correspondent primary. (H) Heatmap reporting fusions of primary and PDX samples belonging to different PTCLs. Only chimeras with a pathogenetic score ≥0.7 are depicted. (I) Antitumoral effect of AZD-6244 in TO-ALCL-Belli PDX model (n = 8 mice/group). Error bars represent standard deviations. (J) Circle pot depicting fusion landscapes of IL-2 and IL19 primary and PDX samples.
Figure 4
Figure 4
PTCL PDX models mutational landscape and clonal evolution (A) Global copy-number variation (CNV) analysis of primary and PDX along propagation. (B) Chromosome view of genes included in the recurrent deleted or amplified genomic regions in PTCL-NOS and ALCL (ALK+ and ALK). (C) Mutational landscape of PTCL primary and PDX samples assessed by WES. Variant sites with read depth lower than five are marked as NA. For the sample ID, “P” stands for primary tumors. (D) Ternary plot of mutation frequency in recurrently mutated genes, comparing primary tumor-specific (left, green), PDX-specific (right, red), and shared (top, blue) alterations. The size of each node represents the mutation frequency. (E) PDX tumor evolutionary directed graph of gene mutations. Arrows show the order in which mutations occur. The size of each node corresponds to the frequency of mutations. (F–H) Tumor evolution models of NY-ALCL-SG, NY-AI-AM, and TO-ALCL-BELLI PDX models. Fish plots (bottom panels) show dynamic changes in CCF of each mutation cluster along serial passages, as depicted in the inferred phylogenetic trees (top panels). (I) Nei’s genetic distance indicates the global evolution score of PDX models. (J) Nei’s genetic distance indicates the global evolution score of PDX derived from different PTCL entities. Error bars represent standard deviations.
Figure 5
Figure 5
The microenvironment of primary and PDX defines distinct subgroups of PTCLs (A) Heatmap of the activity scores of 20 FGES and 4 signaling pathways (x axis) denoting four major TME clusters of primary PTCL (n = 845). In each dataset, signatures were median scaled using median and MAD (median absolute deviation) calculated only for samples with AITL or PTCL-NOS. MFP (microenvironment functional phenotype) portraits were predicted by Louvain clustering (with a threshold of closest points 0.25) within 20 signatures. Samples were sorted by MFP and by diagnosis and for each MFP and diagnosis by proliferation rate increasing. The bottom four molecular pathways were calculated by Progeny. (B) Kaplan-Meier models of OS according to the PTCL TME category. (C) TME annotation by multiplex analysis of PDX. (D) Heatmap of the activity scores of 20 FGES (x axis) denoting four major TME clusters of PDX; signature scores (calculated by single sample Gene Set Enrichment Analysis - ssGSEA - algorithm) were median scaled for each biopsy site separately taking median and MAD only from AITL and PTCL-NOS samples. Oncoplot below the heatmap depicts mutations, ALK, and EBV status. Color palettes on the top indicate MFP, biopsy site, T-cell phenotype, and diagnosis for each sample. (E) Left: Sankey plot showing changes in T differentiation throughout primary and three passages of PDX. Right: plot showing changes in MFP subtypes throughout primary and three passages of PDX. (F) Proportion of macrophages M1 or M2 enriched in PDX by FGES. Error bars represent standard deviations (∗p < 0.05; ∗∗p < 0.001; ∗∗∗p < 0.0001). (G) The proportion of myCAF enriched in selected PDX subtypes by FGES. Error bars represent standard deviations (∗p < 0.05; ∗∗p < 0.001; ∗∗∗p < 0.0001). (H) The proportion of iCAF enriched in PDX by FGES. Error bars represent standard deviations (∗p < 0.05; ∗∗p < 0.001; ∗∗∗p < 0.0001). (I) Barplot of apoptotic lymphoma cells cocultured with and without stromal cells (STCs). Data are representative of three replicates. Error bars represent standard deviations. (J) Gene Ontology analysis indicates the biological processes enriched in educated vs. not-educated SCTs. Error bars represent standard deviations. (K) Unsupervised hierarchical clustering of the top 100 differentially expressed genes in not-educated (cultured in vitro >3 days) and (re)educated (freshly isolated or co-cultured in vitro with PTCL cells >3 days) STCs isolated from PDX. (L) Percentage of viable IL-2 PDX cells cultured in stress conditions alone (red bar) or cocultured with STCs isolated from different PDXs. Data are representative of three replicates. Error bars represent standard deviations. (M) Percentage of viable MT05 PDX cells cultured in stress conditions alone (red bar) or cocultured with STCs isolated from different PDXs. Data are representative of three replicates. Error bars represent standard deviations. (N) Barplots reporting the delta of the specific cell death of PDX-Dlines (IL-2 and IL142A) exposed to 40 drugs with or without STCs (72 h at 1 μM). (O) Barplot showing viable PTCL PDX cells cocultured with STCs or cultured alone in the presence of targeting agents (72 h). Data are representative of three replicates. Error bars represent standard deviations.
Figure 6
Figure 6
Ex vivo PDX drug responses (A) Heatmap showing the magnitude of the cross-correlation of 6 PDX freshly isolated cells exposed to the drug library. (B) Principal-component analysis (PCA) of 19 PDX freshly isolated cells based on the responses to 433 drugs. Circled dotted lines group together samples of PTCL subtype. (C) Heatmap showing the responses of 6 PDX models (19 freshly isolated cell samples) to 433 drugs. Dendrograms on the left and bottom show unsupervised hierarchical clustering of drugs and PDX along the axis of maximum variation (ward) for the Euclidean distances. The dot plot denotes the average drug viabilities per PDX across 433 drugs (top). Dot plot shows the average sample viabilities per drug (right). (D) Dot plots showing the correlation between the expression levels of JAK1 and JAK2 across PTCL subtypes with cell viability after ruxolitinib treatment (72 h, 1 μM). The correlation coefficients and p values are indicated. (E) Heatmap and unsupervised clustering depicting the gene expression within the JAK-STAT pathway. Genes were selected based on the correlation between the expression and viability of samples treated with ruxolitinib (1 μM, 72 h). The viability values are indicated in the upper color bars. (F) Heatmap and unsupervised clustering depicting the gene expression from a regression analysis obtained by modeling the cell viabilities as a function of the PTCL subtypes plus each gene expression. (G) Dot plot showing the predicted vs. actual cell viabilities, with correlation and p value across PTCL subtypes. The prediction derives from the regression analysis in Figure 5F. (H) Heatmap displaying the response of five PDX-Dlines to 40 compounds. Specific cell death is reported in percentage. (I) IC50 assessment in five PDX-Dlines treated in vitro with increasing concentrations of compounds (day 3 and 6). (J) Boxplot indicating the predicted synergy score by the DeepPTCL algorithm for the indicated drug combinations across PTCLs. Error bars represent standard deviations. (K) Percentage of viable IL-2 and IL142A PDX-DLines cultured in the presence of the indicated concentrations of duvelisib and cerdulatinib (IL-2) or duvelisib and venetoclax (IL142A) for 72 h. Data are representative of three replicates. Error bars represent standard deviations.
Figure 7
Figure 7
The mouse hospital and pre-clinical trials (A) PTCL pre-clinical trials overview and Kaplan-Meier plots representative of the overall survival of PDX models. (B) Comparison of IL69 patient and matched PDX responses to CHOP, brentuximab, and crizotinib (n = 8–10 mice/group). Top panel: IL69 patient clinical history. Error bars represent standard deviations. p values were estimated with adjusted t test (∗p < 0.05; ∗∗p < 0.001; ∗∗∗p < 0.0001). Kaplan-Meier curve of the OS (right panel, log rank test, p < 0.0001). (C) Comparison of IL-2 patient and matched PDX responses to ruxolitinib and romidepsin (n = 8–10 mice/group). Top panel: IL-2 patient clinical history. Error bars represent standard deviations. Kaplan-Meier curve of the OS (right panel, log rank test, p = ns: >0.05). (D) Left panel: antitumoral effect of crizotinib alone or in combination with duvelisib in NY-ALCL-SGC PDX (n = 8–10 mice/group). Right panel: antitumoral effect of crizotinib, brentuximab, and ceritinib in NY-ALCL-SG PDX (n = 8–10 mice/group). Error bars represent standard deviations. (E) Antitumoral effect of irinotecan, brentuximab, or combination in ALCL PDX (MT05: cutaneous ALCL - cALCL-, IL69, DN03; IL79: ALK+ ALCL; IL-2: PTCL-NOS). Kaplan-Meier curves of the OS (right panel, log rank test, p < 0.0001). Individual biological and technical replicates are depicted as single lines. (F) Antitumoral effect of pralatrexate, duvelisib, and romidepsin or combinations in IL-2 PTCL-NOS PDX (n = 8–10 mice/group). Error bars represent standard deviations (∗p < 0.05; ∗∗p < 0.001; ∗∗∗p < 0.0001). Kaplan-Meier curves of the OS (right panel, log rank test, p < 0.0001). (G) hCD45 IHC staining of IL129A PDX treated with vehicle or azacytidine. Left panels: mice organs (lungs, kidney, spleen, liver, and heart). Right panels: lungs (40x).
Figure 8
Figure 8
PDX pre-clinical trials support the implementation of drug combinations and immune-based regiments (A) Swimmer plot of PDX models (n = 9 and 36 mice) treated with vehicle, cerdulatinib, AZD-4573, or combination. (B) Barplot depicting PDX tumor size across time points (vehicle, cerdulatinib, AZD-4573, and combination). p values were calculated with one-way ANOVA with adjustment for multiple comparisons ∗: p < 0.05. (C) Kaplan-Meier plots of the global OS of PDX models (n = 9 and 36 mice; log rank test, p = 0.017). (D) Heatmap depicting the top differentially expressed genes in PDX model responders and not-responders to AZD-4573 in vivo treatment. (E) Flow cytometry analysis of TO-ALCL-DN03 (above panels) and IL-2 (below panels) PDX-Dlines cocultured with CART30 cells at the indicated target (red dots)-to-effector (green dots) ratio. (F) Antitumoral effect of CART5 cells alone or combinations with nivolumab in IL-2 PTCL-NOS PDX (n = 6–10 xenografts/group). Error bars represent standard deviations. (G) Antitumoral effect of CART30 cells alone or combinations with nivolumab in NY-ALCL-SG ALK+ALCL PDX (n = 6–10 xenografts/group). Error bars represent standard deviations. (H) Detection of untransduced - UTD -and CART30 within the peri-tumor and tumor masses (CART30 is depicted in green and NY-ALCL-SG cells in red). (I) Multiparametric analysis demonstrates the positive PDL1 expression of NY-ALCL-SG (red color), and CD2 (green) and PD1 (low/partial white) of CART30 cells.

References

    1. Swerdlow S.H., Campo E., Arber D.A., Cazzola M., Cook J.R., Döhner H., Dreyling M., Hasserjian R.P., Jaffe E.S., Orazi A., et al. Response to "The WHO classification of haematolymphoid tumours" (Editorial) Leukemia. 2022;36:2748–2749. doi: 10.1038/s41375-022-01689-9. - DOI - PubMed
    1. Fiore D., Cappelli L.V., Broccoli A., Zinzani P.L., Chan W.C., Inghirami G. Peripheral T cell lymphomas: from the bench to the clinic. Nat. Rev. Cancer. 2020;20:323–342. doi: 10.1038/s41568-020-0247-0. - DOI - PubMed
    1. Vose J., Armitage J., Weisenburger D., International T-Cell Lymphoma Project International peripheral T-cell and natural killer/T-cell lymphoma study: pathology findings and clinical outcomes. J. Clin. Oncol. 2008;26:4124–4130. doi: 10.1200/JCO.2008.16.4558. - DOI - PubMed
    1. Mak V., Hamm J., Chhanabhai M., Shenkier T., Klasa R., Sehn L.H., Villa D., Gascoyne R.D., Connors J.M., Savage K.J. Survival of patients with peripheral T-cell lymphoma after first relapse or progression: spectrum of disease and rare long-term survivors. J. Clin. Oncol. 2013;31:1970–1976. doi: 10.1200/JCO.2012.44.7524. - DOI - PubMed
    1. Khan N., Cheson B.D. PTCL therapies: a review of treatment and outline of novel therapies. Am. J. Therapeut. 2013;20:524–533. doi: 10.1097/MJT.0b013e31828232a3. - DOI - PubMed

Substances

LinkOut - more resources