. 2025 May;24(5):100956.
doi: 10.1016/j.mcpro.2025.100956. Epub 2025 Mar 25.

Bioinformatics-Guided Identification and Quantification of Biomarkers of Crotalus atrox Envenoming and Its Neutralization by Antivenom

Affiliations

Bioinformatics-Guided Identification and Quantification of Biomarkers of Crotalus atrox Envenoming and Its Neutralization by Antivenom

Auwal A Bala et al. Mol Cell Proteomics. 2025 May.

Abstract

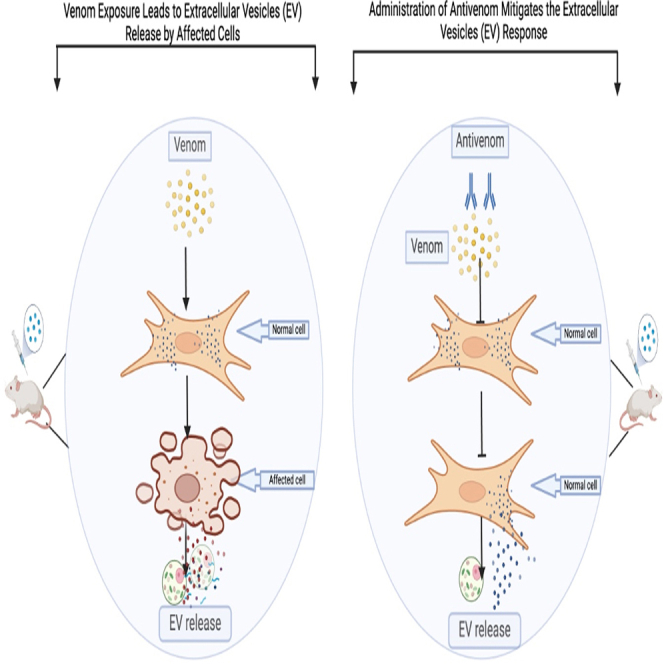
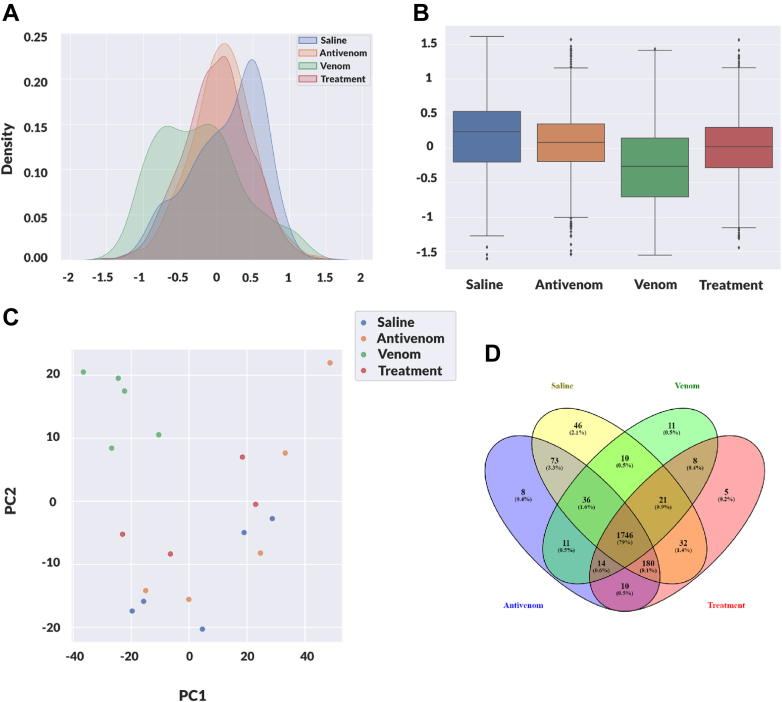
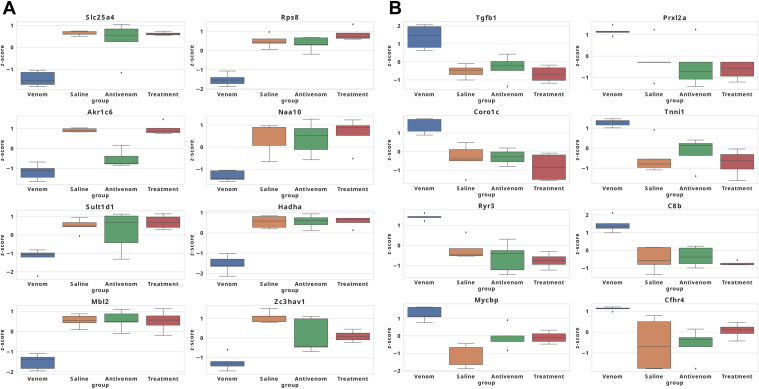
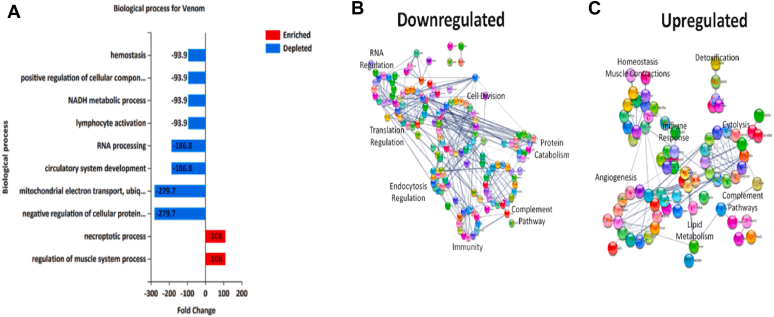
Quantitative mass spectrometry-based proteomics of extracellular vesicles (EVs) provides systems-level exploration for the analysis of snakebite envenoming (SBE) as the venom progresses, causing injuries such as hemorrhage, trauma, and death. Predicting EV biomarkers has become an essential aspect of this process, offering an avenue to explore the specific pathophysiological changes that occur after envenoming. As new omics approaches emerge to advance our understanding of SBE, further bioinformatics analyses are warranted to incorporate the use of antivenom or other therapeutics to observe their global impact on various biological processes. Herein, we used an in vivo BALB/c mouse model and proteomics approach to analyze the physiological impacts of SBE and antivenom neutralization in intact animals; this was followed by bioinformatics methods to predict potential EV biomarkers. Groups of mice (n = 5) were intramuscularly injected with Saline or Crotalus atrox venom. After 30 min, the mice received saline or antivenom (Antivipmyn) by intravenous injection. After 24 h, blood was collected to extract the plasma to analyze the EV content and determine the exposome of C. atrox venom as well as the neutralizing capabilities of the antivenom. The predicted biomarkers consistently and significantly sensitive to antivenom treatment are Slc25a4, Rps8, Akr1c6, Naa10, Sult1d1, Hadha, Mbl2, Zc3hav, Tgfb1, Prxl2a, Coro1c, Tnni1, Ryr3, C8b, Mycbp, and Cfhr4. These biomarkers pointed toward specific physiological alterations, causing significant metabolic changes in mitochondrial homeostasis, lipid metabolism, immunity, and cytolysis, indicating hallmarks of traumatic injury. Here, we present a more comprehensive view of murine plasma EV proteome and further identify significant changes in abundance for potential biomarkers associated with antivenom treatment. The predicted biomarkers have the potential to enhance current diagnostic tools for snakebite management, thereby contributing significantly to the evolution of treatment strategies in the diagnosis and prognosis of SBE.

Keywords: antivenom; extracellular vesicles; proteomics; snakebite; systems biology.


Conflict of interest statement

Conflicts of Interest A.I. is a principal at Tymora Analytical Operations, which developed the EVtrap technology.

Figures

None
Graphical abstract
Fig. 1
Fig. 1
Schematic representation of the procedure. 1. design of the four different conditions with n = 5 for each group. 2. each group received a primary thigh i.m. injection of either saline or venom (1x LD50 i.v. = 102 μg/mouse). 3. a secondary tail vein i.v. of either saline or antivenom (prepared by manufacturer instructions; 17,200 μg/mouse) after 30 min of the primary i.m. injection. 4. blood was collected by cardiac puncture with syringes coated with 0.05 M EDTA after 24 h of the secondary i.v. injection. 5. samples were loaded into a centrifuge at 3000 rpm for 10 min at 4 °C. The plasma was collected separately and stored at −80 °C until the next step. 6. EV isolation with the EVTrap technique. 7. mass spectrometry analysis to identify the EV protein content. 8. various proteomic software utilized for data analysis. i.m., intramuscular; EV, extracellular vesicle.
Fig. 2
Fig. 2
Proteomic characterization of blood plasma EVs from saline, venom, treatment, and antivenom control.A, distribution of protein abundances for each of the four mouse conditions: saline, venom, treatment, and antivenom. Each density curve within the plot corresponds to one of these conditions, representing the mean of standardized protein abundances (in log2 scale) across samples for that condition. The venom condition showcases a unique distribution pattern. In contrast, the distribution of the treatment condition more closely mirrors those of the saline and antivenom conditions. B, box plot of protein abundance for each condition. Venom condition (green) has a distinct distribution from the other conditions. Treatment (red) shifts back the distribution closer to saline and antivenom conditions, in line with the restoration effect of the antivenom. C, PCA analysis of saline (blue), venom (green), antivenom (orange), and treatment (red) conditions. D, Venn diagram comparing the overlapping and unique proteins identified in the treatment (red), venom (green), antivenom (blue), and saline (yellow) conditions. EV, extracellular vesicle; PCA, principal component analysis.
Fig. 3
Fig. 3
Heatmap comparative analysis of protein abundance variations across different conditions.A, heatmap of identified proteins; comparing log ratios with saline condition as reference across 2100 proteins. B, heatmap of top proteins identified by ANOVA; comparing z-standardized protein abundance across conditions.
Fig. 4
Fig. 4
Differential protein expression in volcano plots. A, significantly expressed proteins (in red) when comparing venom versus saline conditions, those positioned to the right are upregulated while those positioned to the left are downregulated. All the significant proteins are listed in the Perseus out and rows containing the top twenty proteins are highlighted in red (supplemental Material S1). B, significantly expressed proteins (in red) when comparing antivenom versus saline conditions, those positioned to the right are upregulated while those positioned to the left are downregulated. C, significantly expressed proteins (in red) when comparing treatment versus saline conditions, those positioned to the right are upregulated while those positioned to the left are downregulated. D, a notable observation is the higher concentration of significant proteins (those positioned toward the top) when comparing the treatment to the venom baseline. This pronounced difference underscores the therapeutic efficacy of the antivenom in neutralizing venom effects.
Fig. 5
Fig. 5
Abundance of the top 10 upregulated proteins. A, Z-standardized protein abundance of the top 10 upregulated proteins with the most significant (BH-adjusted p < 0.05) fold change between venom and nonvenom conditions. B, Z-standardized protein abundance of the top 10 downregulated proteins with the most significant (BH-adjusted p < 0.05) fold change between venom and nonvenom conditions.
Fig. 6
Fig. 6
Abundance of the top 10 downregulated proteins. A, eight downregulated proteins sensitive to antivenom treatment. The depicted eight proteins are identified from the overlap of the top 50 proteins most significantly downregulated in the venom condition and those showing significant upregulation upon treatment. B, top eight upregulated proteins sensitive to antivenom treatment. The selected eight proteins are identified from the overlap of the top 50 proteins most significantly upregulated in the venom condition and those showing significant downregulation upon treatment.
Fig. 7
Fig. 7
Biological and pathway responses.A, the magnitude of impact on the enriched (red) and depleted (blue) biological processes specific to envenoming. B and C, STRING analysis of downregulated/upregulated pathways, respectively.
Fig. 8
Fig. 8
Univariate logistic regression accuracy scores (Top 50) for significant venom biomarkers.A, across upregulated venom biomarkers in discriminating between venom and saline conditions; B, across downregulated venom biomarkers in discriminating between venom and saline conditions.
Fig. 9
Fig. 9
Univariate logistic regression accuracy scores (top 55) for significant venom biomarkers.A, across upregulated treatment biomarkers in discriminating between venom and treatment conditions; B, across downregulated treatment biomarkers in discriminating between venom and treatment conditions.
Fig. 10
Fig. 10
Univariate logistic regression accuracy scores in discrimination analysis. A, distribution of accuracy scores (using individual protein logistic regression) for discriminating between venom and saline conditions; B, similar distribution for discriminating between venom and treatment conditions.
Fig. 11
Fig. 11
Venn diagrams highlighting overlapping significant proteins. A, the intersection of proteins found with significant differences between saline and antivenom conditions using t test (BH adjusted p < 0.05), permutation shuffle (p < 0.05 from 1k permutations), and logistic regression (accuracy >80%). B, similar intersections between venom and treatment conditions.
Fig. 12
Fig. 12
Proposed model of venom and antivenom cellular responses mediated by extracellular vesicles. A, cells exposed to venoms undergo cellular and molecular responses including necrosis and release of extracellular vesicles (exosomes) that communicate with other cells through their contents comprising proteins and nucleic acids. B, administration of antivenom post venom exposure leads to neutralization of venom before it causes significant cellular and molecular changes.

References

    1. Tasoulis T., Isbister G.K. A review and database of snake venom proteomes. Toxins (Basel) 2017;9:290. - PMC - PubMed
    1. Calvete J.J., Sanz L., Angulo Y., Lomonte B., Gutiérrez J.M. Venoms, venomics, antivenomics. FEBS Lett. 2009;583:1736–1743. - PubMed
    1. Mackessy S.P. Morphology and ultrastructure of the venom glands of the northern pacific rattlesnake Crotalus viridis oreganus. J. Morphol. 1991;208:109–128. - PubMed
    1. Markland F.S. Snake venoms and the hemostatic system. Toxicon. 1998;36:1749–1800. - PubMed
    1. Calvete J.J. Venomics: digging into the evolution of venomous systems and learning to twist nature to fight pathology. J. Proteomics. 2009;72:121–126. - PubMed

Supplementary concepts

LinkOut - more resources