. 2025 Mar 27;8(6):e202402601.
doi: 10.26508/lsa.202402601. Print 2025 Jun.

Rheological transition driven by matrix makes cancer spheroids resilient under confinement

Affiliations

Rheological transition driven by matrix makes cancer spheroids resilient under confinement

Tavishi Dutt et al. Life Sci Alliance. .

Abstract

Cancer metastasis through confining peritoneal microenvironments is mediated by spheroids: clusters of disseminated cells. Ovarian cancer spheroids are frequently cavitated; such blastuloid morphologies possess an outer ECM coat. We investigated the effects of these spheroidal morphological traits on their mechanical integrity. Atomic force microscopy showed blastuloids were elastic compared with their prefiguring lumenless moruloid counterparts. Moruloids flowed through microfluidic setups mimicking peritoneal confinement, exhibited asymmetric cell flows during entry, were frequently disintegrated, and showed an incomplete and slow shape recovery upon exit. In contrast, blastuloids exhibited size-uncorrelated transit kinetics, rapid and efficient shape recovery upon exit, symmetric cell flows, and lesser disintegration. Blastuloid ECM debridement phenocopied moruloid traits including lumen loss and greater disintegration. Multiscale computer simulations predicted that higher intercellular adhesion and dynamical lumen make blastuloids resilient. Blastuloids showed higher E-cadherin expression, and their ECM removal decreased membrane E-cadherin localization. E-cadherin knockdown also decreased lumen formation and increased spheroid disintegration. Thus, the spheroidal ECM drives its transition from a labile viscoplastic to a resilient elastic phenotype, facilitating their survival within spatially constrained peritoneal flows.


Conflict of interest statement

The authors declare that they have no conflict of interest.

Figures
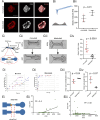
Figure 1.
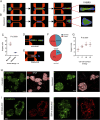
Figure 1.. Ovarian cancer blastuloids relax efficiently and rapidly upon deformation.
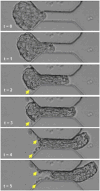
(A) Laser confocal micrographs of moruloid (top) and blastuloid (bottom) OVCAR-3 spheroids showing maximum intensity projections of the fluorescence values representing F-actin (phalloidin; red) and DNA (DAPI; white). (Bi) Schematic depiction of atomic force microscopy performed on spheroids placed on agar beds. (Bii) Graph showing elastic moduli of moruloids (red dots) and blastuloids (black dots) (error bars, mean ± SD). (Ci) Schematic depiction of a microfluidic channel chip used for performing the flow experiments. (Cii) Snapshots of high-speed time-lapse videography moruloids at the entry (top) and exit (bottom) of the channel (see also Video 1). (Ciii) Snapshots of high-speed time-lapse videography blastuloids at the entry (top) and exit (bottom) of the channel (see also Video 2). (Civ) Graph showing aspect ratio slopes of exiting moruloids and blastuloids (see also Fig S1) (error bars, mean ± SD). (Di, Dii) Representative traces showing a change in the minor axis of exited relaxing moruloids (Di) and blastuloids (Dii). (Diii) Graph depicting minor axis normalization ratios for exited relaxing moruloids and blastuloids (error bars, mean ± SD). (Div) Graph depicting minor axis peak time of exited relaxing moruloids and blastuloids (error bars, mean ± SD). (Ei) Schematic representation of entry time. (Eii) Time–size correlation plots of moruloids for entry time. (Eiii) Time–size correlation plots of blastuloids for entry time. Significance was computed using Tukey’s multiple comparisons test (see Supplemental Data 1 for statistics). Scale bars = 50 μm. Each result is derived from ≥3 independently performed experiments.
Figure S1.
Figure S1.. Aspect ratio measurement for moruloids and blastuloids.
(Left top) Scatter plot showing minor axis evolution with area of the exiting cluster for a representative moruloid (red), blastuloid (black), and ECM-removed blastuloid. (Left bottom) Representative image showing cluster aspect ratio calculated as L/w. The red curve represents the protruding portion used for ellipse fitting. (Middle) Calculation of aspect ratio for the high-speed images, taken at four time points during the exit of a representative moruloid, blastuloid, and ECM-removed blastuloid spheroid. The ellipse is fit to the protruding edge using MATLAB, and the obtained curves for all the four images (for each population) are shown next to the snapshots as dotted ellipses. (Right) Aspect ratio variation with time for a representative moruloid, blastuloid, and ECM-removed blastuloid spheroid. The four datapoints are fit using a linear fit, and subsequent equation gives the slope. Scale bar = 50 μm.
Figure S2.
Figure S2.. Intercellular movement in patient and cell-line spheroids.
Particle image velocimetry shows vectors sized based on magnitudes (yellow) overlaid on an image of ingressing moruloids (first from left) and blastuloids (second from left) from a patient with high-grade serous ovarian cancer with ascites and from moruloids (second from right) and blastuloids (right most) from the G1M2 patient xenograft cell line. The top row shows images for spheroids during entry, and the bottom row shows the images for spheroids during exit. Red portions represent the masked areas not analyzed for flow. Scale bar = 50 μm.
Figure 2.
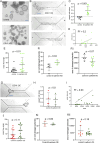
Figure 2.. Ovarian cancer blastuloids exhibit minimal intercellular rearrangement.
(Ai, Aii) Particle image velocimetry shows velocity vectors sized based on magnitudes (yellow) overlaid on an image of ingressing moruloid (Ai) and blastuloid (Aii). (Aiii) Graph showing mean flow angles of ingressing moruloids and blastuloids (error bars, mean ± SD). (Bi, Bii) Particle image velocimetry shows vectors sized based on magnitudes (yellow) overlaid on an image of ingressing moruloid (Bi) and blastuloid (Bii). (C) Representative images showing cell detachment and disintegration in moruloid spheroids as they traverse the constrictive channel; red ellipses highlight damage (see also Fig S3). (Di, Dii) Graph showing percent spheroid damage of exiting moruloids and blastuloids (Di) (error bars, mean ± SEM) and areas of damaged spheroids for moruloids and blastuloids (Dii) (error bars, mean ± SD). Significance was computed using Tukey’s multiple comparisons test (see Supplemental Data 1 for statistics). Scale bars = 50 μm. Each result is derived from ≥3 independently performed experiments.
Figure S3.
Figure S3.. Photographs of moruloid ingression at consecutive seconds of a high-speed time-lapse imaging experiment showing cellular detachment and spheroid damage (yellow arrowheads) because of constrictive traversal.
Scale bar = 50 μm.
Figure 3.
Figure 3.. Ovarian cancer blastuloids show higher intercellular adhesion.
(A, B) Snapshots of CompuCell3D simulations of digital moruloid (A) and blastuloid (B) spheroids traversing through a spatially constrictive channel representing time points when the spheroids enter the channel (left), inside the channel (middle), and during exit from the channel (right). Insets show the intercellular arrangement within the digital spheroids upon exit. (C) Scatter graph showing the difference between aspect ratios of digital moruloid and blastuloid spheroids upon exit from the channel normalized to the same at entry (error bars, mean ± SD). (D, E) Snapshot of a CompuCell3D simulation of a digital moruloid (D) and blastuloid (E) spheroid showing disintegration and cell detachment upon traversal. (F) Pie chart representing the fraction of spheroid disintegration upon traversal for digital moruloid (top) and blastuloid (bottom) spheroids. (G) Scatter graph of the normalized aspect ratios of digital moruloid spheroids with different values of cell–cell contact energy used in the multiscale simulation. One-way ANOVA was used to compute statistical significance (error bars, mean ± SD). (H) Laser confocal micrographs of moruloid and blastuloid OVCAR-3 spheroids showing maximum intensity projection of the fluorescence values representing E-cadherin (green) and counterstaining for F-actin (phalloidin; red) and DNA (DAPI; white). (I) Laser confocal micrographs of blastuloid OVCAR-3 spheroids (untreated control left) and upon type IV collagenase treatment (right) showing middle stack of the fluorescence values representing E-cadherin (red) and counterstaining for F-actin (phalloidin; green) (see also Fig S5). (C, G) Significance was computed using an unpaired t test for (C) and Tukey’s multiple comparisons test for (G) (see Supplemental Data 1 for statistics). Scale bars = 50 μm. Each result is derived from ≥3 independently performed experiments.
Figure S4.
Figure S4.. Phase-contrast micrographs of OVCAR-3 moruloids cultured in defined media supplemented with 2% laminin-rich basement membrane matrix showing microlumina (left) or central lumen (middle) and compacted exterior, compared with a dysmorphic lumenless morphology of moruloids suspended without matrix supplementation.
Scale bar = 50 μm.
Figure S5.
Figure S5.. Phase-contrast micrographs of OVCAR-3 blastuloids showing a central lumen (left), which is lost upon treatment with type IV collagenase (right).
Scale bar = 50 μm.
Figure S6.
Figure S6.. Laser confocal micrographs of blastuloid OVCAR-3 spheroids (top) and ECM-removed blastuloid OVCAR-3 spheroids (bottom) showing mid stack of the fluorescence values representing type IV collagen (green) and counterstaining for DNA (DAPI; white).
Scale bars = 50 μm.
Figure 4.
Figure 4.. ECM removal in blastuloids results in mechanical behavior typical of moruloids.
(A) Graph showing elastic moduli of blastuloids upon ECM removal (error bars, mean ± SD). (B) Snapshots of high-speed time-lapse videography blastuloids with ECM removal at the entry (left) and exit (right) of the channel (see also Video 11). (C) Graph showing the aspect ratio slopes of exiting blastuloids upon ECM removal (see also Fig S1) (error bars, mean ± SD). (Di) Representative traces showing a change in the minor axis of exited relaxing ECM-removed blastuloids. (Dii) Graph showing the minor axis normalization ratio for exited relaxing ECM-removed blastuloids (error bars, mean ± SD). (Diii) Graph showing minor axis peak time of exited relaxing ECM-removed blastuloids (error bars, mean ± SD). (E) Graphs showing size–time correlation plots of ECM-removed blastuloids for entry time. (F) Graph showing mean flow angles for ingressing ECM-removed blastuloids (error bars, mean ± SD). (Gi, Gii) Graph showing percent spheroid damage of exiting ECM-removed blastuloids (Gi) (error bars, mean ± SEM) and areas of damaged ECM-removed blastuloids (Gii) (error bars, mean ± SD). Significance was computed using Tukey’s multiple comparisons test (see Supplemental Data 1 for statistics). Scale bars = 50 μm. Each result is derived from ≥3 independently performed experiments.
Figure 5.
Figure 5.. E-cadherin depletion phenocopies ECM debridement.
(A) Phase-contrast micrographs of scrambled control OVCAR-3 blastuloids and E-cadherin–depleted OVCAR-3 spheroids (see Fig S7, left) showing the presence of lumen in the former and absence in the latter. (B) Traversal of E-cadherin–depleted OVCAR-3 spheroids at ingress (top), within the channel (middle) and at exit (bottom). (C) Graph showing aspect ratio slopes of exiting scrambled control OVCAR-3 blastuloids and E-cadherin–depleted OVCAR-3 spheroids (error bars, mean ± SD). (D) Time–size correlation plots of control blastuloids for entry time (see Fig S8) and of E-cadherin–depleted OVCAR-3 spheroids for entry time. (E) Graph showing mean flow angles of exiting scrambled control OVCAR-3 blastuloids and E-cadherin–depleted OVCAR-3 spheroids (error bars, mean ± SD). (Fi, Fii) Graph showing percent spheroid damage of exiting scrambled control OVCAR-3 blastuloids and E-cadherin–depleted OVCAR-3 spheroids (Fi) (error bars, mean ± SEM) and areas of damaged spheroids (Fii) for exiting scrambled control OVCAR-3 blastuloids and E-cadherin–depleted OVCAR-3 spheroids (error bars, mean ± SD). (G) Traversal of E-cadherin–overexpressing OVCAR-3 spheroids (see Fig S7) at ingress (top) and at exit (bottom). (H) Graph showing aspect ratio slopes of exiting vector control OVCAR-3 moruloids and E-cadherin–overexpressing OVCAR-3 spheroids (error bars, mean ± SD). (I) Time–size correlation plots of control moruloids for entry time (see Fig S8) and of E-cadherin–overexpressing OVCAR-3 spheroids for entry time (I). (J) Graph showing mean flow angles of exiting vector control OVCAR-3 moruloids and E-cadherin–overexpressing OVCAR-3 spheroids (error bars, mean ± SD). (Ki, Kii) Graph showing percent spheroid damage of exiting vector control OVCAR-3 moruloids and E-cadherin–overexpressing OVCAR-3 spheroids (Ki) (error bars, mean ± SEM) and areas of damaged spheroids (Kii) for exiting vector control OVCAR-3 moruloids and E-cadherin–overexpressing OVCAR-3 spheroids (error bars, mean ± SD). Significance was computed using unpaired t test (see Supplemental Data 1 for statistics). Scale bars = 50 μm. Each result is derived from ≥3 independently performed experiments.
Figure S7.
Figure S7.. qRT–PCR showing the relative expression of E-cadherin mRNA in cells, which were transduced lentivirally with shRNA cognate to E-cadherin relative to scrambled control (left) and with whole-length human E-cadherin relative to empty vector control (right).
Figure S8.
Figure S8.. Plot showing spheroid size–time correlation of scrambled shRNA control blastuloids for entry time (top), and of empty vector control moruloids for entry time (bottom left).

References

    1. Lengyel E (2010) Ovarian cancer development and metastasis. Am J Pathol 177: 1053–1064. 10.2353/ajpath.2010.100105 - DOI - PMC - PubMed
    1. Shield K, Ackland ML, Ahmed N, Rice GE (2009) Multicellular spheroids in ovarian cancer metastases: Biology and pathology. Gynecol Oncol 113: 143–148. 10.1016/j.ygyno.2008.11.032 - DOI - PubMed
    1. Langthasa J, Sarkar P, Narayanan S, Bhagat R, Vadaparty A, Bhat R (2021) Extracellular matrix mediates moruloid-blastuloid morphodynamics in malignant ovarian spheroids. Life Sci Alliance 4: e202000942. 10.26508/lsa.202000942 - DOI - PMC - PubMed
    1. Koike C, McKee TD, Pluen A, Ramanujan S, Burton K, Munn LL, Boucher Y, Jain RK (2002) Solid stress facilitates spheroid formation: Potential involvement of hyaluronan. Br J Cancer 86: 947–953. 10.1038/sj.bjc.6600158 - DOI - PMC - PubMed
    1. Goyeneche A, Lisio MA, Fu L, Srinivasan R, Valdez Capuccino J, Gao ZH, Telleria C (2020) The capacity of high-grade serous ovarian cancer cells to form multicellular structures spontaneously along disease progression correlates with their orthotopic tumorigenicity in immunosuppressed mice. Cancers 12: 699. 10.3390/cancers12030699 - DOI - PMC - PubMed

LinkOut - more resources