

Social Predictors of Hearing Aid Purchase: Do Stigma, Social Network Composition, Social Support, and Loneliness Matter?
- PMID: 40148265
- PMCID: PMC12352571
- DOI: 10.1097/AUD.0000000000001656
Social Predictors of Hearing Aid Purchase: Do Stigma, Social Network Composition, Social Support, and Loneliness Matter?
Abstract
Objectives: The purpose of this study was to evaluate the extent to which four different social factors (stigma, social network composition, social support, and loneliness) predict the purchase of hearing aids in a sample of older adults with impaired hearing who had not previously tried hearing aids and visited a hearing care clinic for the first time.
Design: Data collection took place across 130 different hearing care clinics (Connect Hearing) in Canada. A total of 4630 participants were recruited for the study from notices in the waiting rooms of the clinics or by advertising in local newspapers. The final sample consisted of 753 adults (mean age = 69.2 years; SD = 9.0; 57.4% male) who were all recommended to try hearing aids. Clinical records were tracked for a minimum of 3 months and a maximum of 15 months after the appointment to determine if they obtained hearing aids. Participants completed a 56-item questionnaire before their appointment and then experienced standard care at the clinic (i.e., hearing evaluation, hearing rehabilitation if desired, etc.). Key factors assessed by the questionnaire included stigma related to age, stigma related to hearing aids, social network composition, perceived levels of social support, loneliness, self-reported hearing disability, and demographic information.
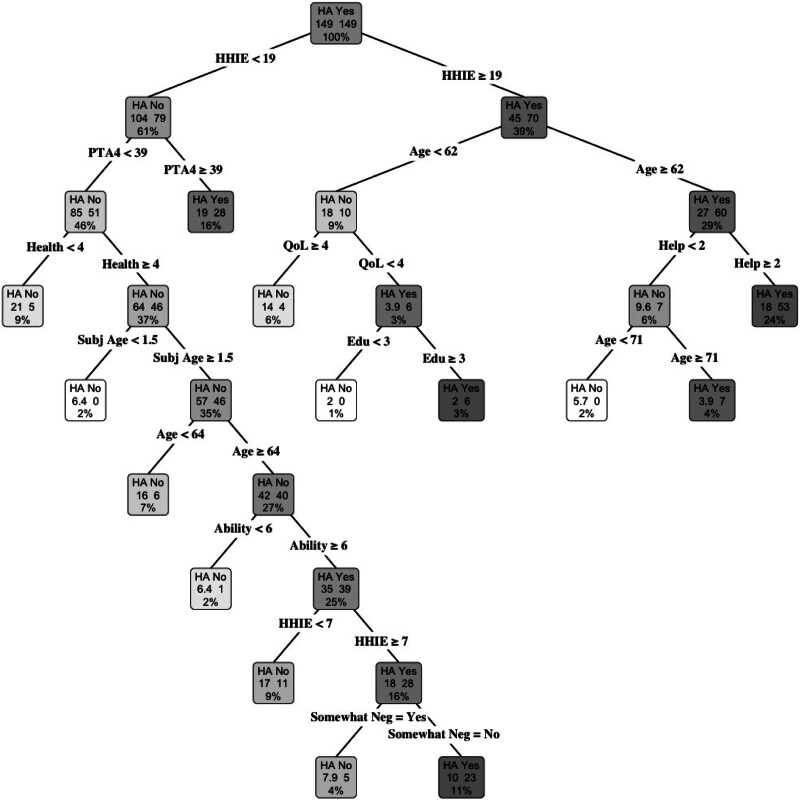
Results: Data were analyzed using two methods, a penalized logistic regression and a classification tree analysis, to identify statistical predictors and meaningful clinical cutoff scores, respectively. Both models found that hearing aid adoption was best predicted by being older and having greater self-reported hearing disability. Hearing aid uptake was also predicted by social factors, but these predictors were less robust than age and self-reported hearing disability. Participants were more likely to adopt hearing aids if they reported less hearing aid stigma and had a social network that included at least 1 person with a suspected hearing loss. Loneliness and social support did not predict hearing aid adoption. Some model-specific variables also emerged.
Conclusions: Using a prospective research design, the study provides novel quantitative evidence of the role of different social factors regarding the uptake of hearing aids. The research findings may be used to better identify individuals more and less likely to obtain hearing aids, inform hearing rehabilitation, and motivate the use of interventions designed to lessen the impact of stigma on hearing rehabilitation.
Keywords: Hearing aid adoption; Hearing rehabilitation; Loneliness; Social networks; Social support; Stigma.
Copyright © 2025 The Authors. Ear & Hearing is published on behalf of the American Auditory Society, by Wolters Kluwer Health, Inc.
Conflict of interest statement
The authors have no conflicts of interest to disclose.
Figures
References
-
- Aral S., & Walker D. (2014). Tie strength, embeddedness, and social influence: A large-scale networked experiment. Manage Sci, 60, 1352–1370.
-
- Barrett A. E., & Toothman E. L. (2014). Baby Boomers’ subjective life course and its physical health effects: How distinctive is the “forever young” cohort? Int J Aging Hum Dev, 79, 109–129. - PubMed
MeSH terms
LinkOut - more resources
Full Text Sources
Medical
