. 2025 Mar 27;16(1):2992.
doi: 10.1038/s41467-025-58307-2.

A mouse model of cardiac immunoglobulin light chain amyloidosis reveals insights into tissue accumulation and toxicity of amyloid fibrils

Affiliations

A mouse model of cardiac immunoglobulin light chain amyloidosis reveals insights into tissue accumulation and toxicity of amyloid fibrils

Gemma Martinez-Rivas et al. Nat Commun. .

Abstract

Immunoglobulin light chain (LC) amyloidosis (AL) is one of the most common types of systemic amyloidosis but there is no reliable in vivo model for better understanding this disease. Here, we develop a transgenic mouse model producing a human AL LC. We show that the soluble full length LC is not toxic but a single injection of pre-formed amyloid fibrils or an unstable fragment of the LC leads to systemic amyloid deposits associated with early cardiac dysfunction. AL fibrils in mice are highly similar to that of human, arguing for a conserved mechanism of amyloid fibrils formation. Overall, this transgenic mice closely reproduces human cardiac AL amyloidosis and shows that a partial degradation of the LC is likely to initiate the formation of amyloid fibrils in vivo, which in turn leads to cardiac dysfunction. This is a valuable model for research on AL amyloidosis and preclinical evaluation of new therapies.


Conflict of interest statement

Competing interests: The authors declare no competing interests.

Figures

Fig. 1
Fig. 1. Generation of the transgenic mouse model λS-DH.
A Transgenic strategy used to achieve a high production of human free light chains in the mice consists in the insertion of the λS-LC from the λS-PT in the mouse κLC locus. These mice were backcrossed with the DH-LMP2A mice to avoid the association between human LCs and mouse-heavy chains. B Flow cytometry on spleen cells of WT and λS-DH mice. CD138 and B220 staining allows to identify plasma cells and B cells respectively. Intracellular staining of with anti hλ-LC allows to show the plasma cells producing the transgenic λS-LC. Graphs are representative examples from the analyzed mice (n = 3 WT and n = 3 λS-DH). C Serum dosage of the circulating free light chains in the patient (λS-PT) at diagnosis and the transgenic mice without (λS, n = 4) and with (λS-DH) the DH-LMP2A allele of 2–6 months old (n = 20) and >6 months old (n = 16) mice. Representation of single values with mean (gray bar) ± SD.
Fig. 2
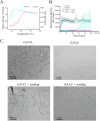
Fig. 2. In vitro characteristics of λS-LC species.
A Stability of the recombinant λS proteins, rλS-LC (pink) and rλS-VL (green) was measured by the ratio of the fluorescence at 350 and 330 nm (solid line) upon thermal denaturation. The melting temperature (Tm) for each sample was given by the maximum peaks of the 350/330 nm ratio first derivative (dotted line). The curves correspond to the mean of 3 different measurements for the rλS-LC and 4 for the rλS-VL, and the error bars correspond to SD. B Kinetics of fibril formation in vitro with the different λS protein species with (light green and pink) or without seeding (dark green and pink). The aggregation kinetics was followed by the measurement of the fluorescence of Thioflavin T. Represented in mean ± SD of 3 different experiments in duplicate. C Representative TEM analysis of the samples from (B) without (upper panel) or with (lower panel) seeding.
Fig. 3
Fig. 3. Amyloidosis induction in λS-DH mice with VL fibrils.
A Protocol of amyloidosis induction with rλS-VL seeds. B Histological characterization of CR birefringence under polarized light (top) and fluorescence (bottom) on frozen tissues. A glomerulus is circled with dotted line. Representative example of a mouse analyzed at 6 months after induction. C Hematoxylin-Eosin and CR staining in a paraffin-embedded heart. Birefringence was visible in the myocardium of the ventricular wall, atrial wall, and around blood vessels throughout the tunica media and adventitia. Representative example of a mouse at 9 months after induction. D Organs from induced mice (λS-DH, red, and controls, blue) were analyzed histologically with CR staining at different time points after the injection. AL-positive mice were determined by the presence of CR fluorescence in the heart, and the penetrance was calculated as the ratio of positive mice to the total number of mice analyzed at each timepoint (indicated below the graph) (E) The amyloidosis score was calculated for the positive mice from (D) (n = 10 at <1 week, n = 12 at 1–2 months (Mo), n = 14 at 3–5 months and n = 6 at >6 months) by the CR fluorescence in the cardiac tissue, corresponding to: score 1 (low), score 2 (mid) and score 3 (high). Score assessment is described in the methods and Fig. S3A. Representation of the single values with mean (gray bar) ± SD. Comparisons were performed by Mann–Whitney two-sided test. Exact P values are indicated. F Electron microscopy of the cardiac tissue showing the amyloid fibrils in the extracellular compartment of a score 3 mouse. G Representative image of fibrotic tissue revealed with a Masson’s Trichrome staining in the hearts of a score 3 mouse (left) and a control (right).
Fig. 4
Fig. 4. Typing of the amyloid deposits in λS-DH mice.
A Cardiac deposits were revealed by CR fluorescence and its colocalization with an anti-human λLCs antibody coupled to FITC. This monoclonal antibody recognizes specifically an epitope of the constant domain of λ-LCs. Representative image of a score 3 mouse. All CR-analyzed mice were co-stained with this antibody. B Colocalization between CR staining and human λ-LCs was also confirmed in the kidney and the spleen of mice. Same mouse as in (A). C The typing of the amyloidosis was confirmed by immunoelectron microscopy (n = 2) with anti-human λ-LCs gold-labeled antibody (top) in the cardiac tissue of a score 3 mouse. Anti-human κ-LCs gold-labeled antibody was used as a control (bottom).
Fig. 5
Fig. 5. Amyloid deposits induction in λS-DH mice with soluble λS-VL.
A Protocol of amyloidosis induction with soluble rλS-VL. B Organs from induced mice (λS-DH, red, and controls, blue) were analyzed histologically with a CR staining at different time points after the injection. AL-positive mice were determined by the presence of CR fluorescence in the heart, and the penetrance was calculated as the ratio of positive mice to the total number of mice analyzed at each time point (indicated below the graph). C The amyloidosis score (1, 2, and 3) was calculated for the positive mice in the cardiac tissue (n = 3 at 1–2 months (Mo), n = 8 at 3–5 months, and n = 21 at >6 months). Representation of the single values with mean (gray bar) ± SD. D Histological characterization of mice deposits with CR staining revealed birefringence (left) and fluorescence (right) of the CR and colocalization with the anti-hλ-LCs antibody in the heart, the spleen, and the kidneys. Representative images of a score 3 mouse.
Fig. 6
Fig. 6. Molecular characteristics of the amyloid deposits in λS-DH mice.
A Analysis of the purified λS-DH fibrils by SDS-Page and Western Blot. Total protein was revealed by the Stain-Free technology (Biorad). Blotting was performed with an anti-human Vλ6-57 antibody. Images are representative examples from n = 3 independent experiments. B Mass spectrometry analysis of ex vivo purified fibrils obtained from 3 extractions (n = 5 hearts). The protein content of samples was given by the EmPAI scores (single values with mean). Only the amyloid signature proteins are shown. ApoE Apolipoprotein E, ApoA4 Apolipoprotein A4, Vtnc Vitronectin, Sap Serum amyloid P component, Col6A1 Collagen type VI alpha 1 chain, Col6A2 Collagen type VI alpha 2 chain (C) Analysis of deposited light chains in an amyloid-positive mouse by 2D-PAGE and 2D western blotting using anti-hλ LCs (n = 3). The boxed region matches the corresponding region of the image shown in (D). D Coomassie-stained gel from the boxed region in (C) (left). The spots whose position matches the immunoreactive spots in the western blot shown in (C) (circled) were excised, trypsin-digested, and analyzed by LC-MS/MS. The coverage of the monoclonal light chain sequence in each spot, from the tryptic peptides identified by LC-MS/MS, is represented in green on the right.
Fig. 7
Fig. 7. Analysis of the cardiac function related to amyloid deposition in λS-DH mice.
A Plasma NT-proBNP was dosed in score 2-3 amyloid-positive λS-DH (AL, n = 13, red), λS-DH mice without amyloid deposition (LS, n = 13, yellow) and DH mice (n = 14, blue). B Cardiac measurement of the diastolic (d) left ventricular (LV) posterior wall by Ultrasound analysis in age-matched DH control mice (Sham, n = 6) and λS-DH with a cardiac amyloid deposition (AL, n = 6) (left). C Cardiac filling pressure, given by the E/E’ ratio analyzed on the same mice as in (B). D Cardiac early diastolic strain rate (SRE) analyzed as in (B). E Heatmaps showing the differentially expressed genes (DEG, log2 fold change |FC| ≥ 0.58 and False Discovery Rate FDR < 0.05) in λS-DH mice with cardiac deposits (AL, n = 9) compared to DH mice (Ctrl, n = 7, left) and compared to λS-DH mice without deposits (LS, n = 4, right). Mice were clustered according to the DE profiles. Red corresponds to overexpressed genes and blue to downregulated genes. F Weighted scoring representation of the enriched Reactome pathways (associated to the 2034 DEG (log2 |FC | ≥ 1 FDR < 0.05)) when comparing AL vs Ctrl + LS (n = 11). G Overexpressed genes associated to the extracellular matrix organization, complement cascade or cardiac dysfunction, and fibrotic processes pathways according to their FC (log2) and their FDR (−log2). Histograms show individual values with mean ± SD. Comparisons in (A, D) were performed by Mann-Whitney two-sided test. Exact P values are indicated.

References

    1. Merlini, G. & Stone, M. J. Dangerous small B-cell clones. Blood108, 2520–2530 (2006). - PubMed
    1. Sanchorawala, V. Systemic light chain amyloidosis. N. Engl. J. Med.390, 2295–2307 (2024). - PubMed
    1. Comenzo, R. L., Zhang, Y., Martinez, C., Osman, K. & Herrera, G. A. The tropism of organ involvement in primary systemic amyloidosis: contributions of Ig V(L) germ line gene use and clonal plasma cell burden. Blood98, 714–720 (2001). - PubMed
    1. Bodi, K. et al. AL-base: a visual platform analysis tool for the study of amyloidogenic immunoglobulin light chain sequences. Amyloid16, 1–8 (2009). - PMC - PubMed
    1. Blancas-Mejía, L. M., Hammernik, J., Marin-Argany, M. & Ramirez-Alvarado, M. Differential effects on light chain amyloid formation depend on mutations and type of glycosaminoglycans. J. Biol. Chem.290, 4953–4965 (2015). - PMC - PubMed