. 2025 Mar 27;16(1):3007.
doi: 10.1038/s41467-025-57719-4.

Chromatin landscape at cis-regulatory elements orchestrates cell fate decisions in early embryogenesis

Affiliations

Chromatin landscape at cis-regulatory elements orchestrates cell fate decisions in early embryogenesis

Francesco Cardamone et al. Nat Commun. .

Abstract

The establishment of germ layers during early development is crucial for body formation. The Drosophila zygote serves as a model for investigating these transitions in relation to the chromatin landscape. However, the cellular heterogeneity of the blastoderm embryo poses a challenge for gaining mechanistic insights. Using 10× Multiome, we simultaneously analyzed the in vivo epigenomic and transcriptomic states of wild-type, E(z)-, and CBP-depleted embryos during zygotic genome activation at single-cell resolution. We found that pre-zygotic H3K27me3 safeguards tissue-specific gene expression by modulating cis-regulatory elements. Furthermore, we demonstrate that CBP is essential for cell fate specification functioning as a transcriptional activator by stabilizing transcriptional factors binding at key developmental genes. Surprisingly, while CBP depletion leads to transcriptional arrest, chromatin accessibility continues to progress independently through the retention of stalled RNA Polymerase II. Our study reveals fundamental principles of chromatin-mediated gene regulation essential for establishing and maintaining cellular identities during early embryogenesis.


Conflict of interest statement

Competing interests: The authors declare no competing interests.

Figures

Fig. 1
Fig. 1. Histone H3K27 trimethylation and acetylation dynamics during early embryonic development.
a Schematic representation of early embryonic development. After fertilization, the Drosophila embryo undergoes rapid and syncronous cycles of nuclear divisions. By cycle 14 (stage 5), nuclei migrate to the periphery of the syncytium, get cellularized and transcriptionally activate their genome (ZGA). b Representative immunofluorescence staining from three biological replicates across early embryonic development. H3K27me3 and H3K27ac localize to chromatin before ZGA. Scale bar, 5 µm. c Chromatin dynamics during early embryonic development. The alluvial plot shows the epigenetic states from before cycle 9 to cycle 14, based on H3K27me3, H3K27ac, H3K27me3/ac (putative ambivalent) or unassigned peaks. Blue cluster represents H3K27me3 specific peaks, purple cluster represents putative ambivalent peaks, and orange cluster represents H3K27ac specific peaks. Gray clusters represent unassigned peaks in each time point. d Genome browser snapshot of a putative ambivalent locus throughout early embryogenesis from bulk CUT&Tag normalized profiles (see Methods) for H3K27ac (in orange) and H3K27me3 (in blue). The putative ambivalent peaks are highlighted by purple dashed boxes. e Heat maps of normalized CUT&Tag signal (see Methods) for H3K27me3 and H3K27ac at cycle 14 (ZGA). The intensity of the signal is centred on peak cathegories specific to cycle 14, ranked based on H3K27me3. Blue cluster represents H3K27me3 peaks, purple cluster represents ambivalent peaks (H3K27me3/ac) and orange cluster represents H3K27ac peaks.
Fig. 2
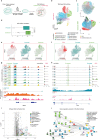
Fig. 2. Single-cell multiomic profiling reveals enhancer-guided early cell fate commitment in ZGA embryos.
a Experimental design and schematic representation of collection strategy and manual selections of ZGA embryos. Nuclei are isolated and processed for 10× Multiome (scATAC-seq + scRNA-seq). Adapted from an image created in BioRender. Cardamone, F. (2025) https://BioRender.com/a06c492. b UMAP embedding of scRNA-seq data of two integrated biological replicates of the ZGA embryo. Cluster identities were assigned by expression of marker genes. A-P ectoderm, anterior-posterior ectoderm. c UMAP embedding of scATAC-seq based on either promoter peaks or enhancer peaks associated to the highly variable genes, highlighting the contribution of enhancer regions in driving germ layers definition. d Distribution of spearman correlation between gene expression (GEX) and accessibility (ATAC) of highly variable genes (HGVs) at their most accessible promoter peak or at their highest score linked peak (enhancer), in each single-cell. Boxes center refers to mean, lower and upper quartiles (Q1 and Q3, respectively). Whiskers, 1.5 × IQR below Q1 and above Q3. Outliers are shown. Two-sided Mann–Whitney U test. P = 3.45 × 10−22. e, f Gene expression (GEX) or chromatin accessibility of most accessible promoter peak or highest score linked peak (enhancer) of Mes2 (mesoderm marker gene) and Lim1 (anterior endoderm marker gene). Dashed boxes highlight the germ layer where the gene is expressed. g, h Genome browser snapshot of Mes2 and Lim1 loci. Top, aggregated ATAC reads of each germ layer and violin plot of the respective Mes2 or Lim1 gene expression (GEX). Promoter is highlighted by blue dashed box, enhancer is highlighted by green dashed box. Bottom, ChIP-seq signal of H3K27me3 (this study), H3K27ac and RNA polymerase II (RNAPII) from mesoderm sorted nuclei. MESO, mesoderm. AP-ECTO, anterior-posterior ectoderm. D-ECTO, dorsal ectoderm. N-ECTO, neural ectoderm. V-ECTO, ventral ectoderm. A-ENDO, anterior endoderm. P-ENDO, posterior endoderm. YLK, yolk. i Volcano plot showing differential gene expression analysis in ZGA versus before ZGA embryos. Dot colour represents the marker genes used to annotate the 10× Multiome dataset or significance. Two-sided Wald test. Source data are provided as Source Data file. j Gene regulatory network of the wild-type ZGA embryo inferred by Pando on the 10× Multiome dataset. Dot colour represents the annotated germ layer of the cell with the highest gene expression value for each gene.
Fig. 3
Fig. 3. Loss of cell fate occurs upon chromatin factors depletion.
a Experimental design. Early embryos depleted of CBP or E(z) are aged and hand-selected at ZGA based on their morphology. Subsequently, nuclei isolation is performed and 10× Multiome (scATAC-seq + scRNA-seq) is performed in two biological replicates. Adapted from an image created in BioRender. Cardamone, F. (2025) https://BioRender.com/a06c492. b UMAP embedding of integrated scRNA-seq of wild-type, E(z)-KD and CBP-KD data. Left, cluster identities were assigned based on the respective genotype. Right, cluster identities were assigned by expression of marker genes. c Bar plot showing the relative abundance per annotated germ layer. To calculate the relative abundance, the total number of cells in each genotype was considered. UNDF, undifferentiated cells. UNDF-2, undifferentiated cells 2 (CBP-KD specific). d Average log2 fold change of marker gene expression upon E(z)-KD or CBP-KD. The heat map shows ectopic expression of marker genes upon loss of E(z) or complete shut-down of transcription upon CBP-KD. e Correlation plot between differential GEX and accessibility of promoters (dark green) or enhancers (light green) of marker genes upon E(z)-KD in each single cell. Spearman correlation coefficient (R) and P-value (P) are shown. Data are presented as mean values +/− SD. f Top, Gene expression (GEX) of Ptx1 (posterior endoderm marker gene) in wild-type, E(z)-KD and CBP-KD. Pie charts represent fraction of cells expressing the gene within each germ layer. Bottom, Representative in situ hybridization image from three biological replicates of Ptx1 RNA in wild-type, E(z)-KD and CBP-KD. A anterior, P posterior, D dorsal, V ventral. g Top, Genome browser snapshot of Ptx1 locus. Differential accessibility between E(z)-KD and wild-type cells in different germ layers. Promoter (P) is highlighted with a blue dashed box while enhancer (E) is highlighted with a green dashed box. Bottom, Differential CUT&Tag signal between E(z)-KD and wild-type for H3K27me3 and H3K27ac. h Gene identity network of wild-type, E(z) and CBP depleted embryos. Gene ID score refers to the ratio of expressing cells which are annotated as the expected germ layer, with respect to the total number of cells.
Fig. 4
Fig. 4. Transcriptomic and epigenomic temporal dynamics upon chromatin factors depletion reveal transcription-independent chromatin progression.
a Schematic of early Drosophila development, from fertilization to diversification events. Early, middle and late time points are highlighted in pink, light purple and dark purple respectively. b Analysis design. 10× Multiome data from wild-type, E(z)-KD and CBP-KD nuclei at ZGA were projected in the sci-RNA-seq or sci-ATAC-seq continuum of Drosophila embryogenesis to assess the developmental progression of each projected genotype for both transcription and chromatin accessibility. c UMAP embedding of the scRNA-seq (GEX) data colored by genotype with respective bar plot representing the fraction of nuclei enriched in each developmental time point. The projection shows the developmental delay caused by the absence of CBP. d Same as (c) but for scATAC-seq peaks (ATAC). The projection highlights the dispensable function of CBP in establishing global accessibility.
Fig. 5
Fig. 5. CBP stabilizes pioneer factors binding on chromatin through a possible coiled coil interaction.
a Heat map of active ZGA genes identified by GRO-seq, clustered by their dependency on the pioneer factor Zelda (Zld-dep) or neither regulated by Zelda or H2A.Z (H2A.Z negative) Signal is centred around +/− 2 kb from TSS. Sorting is based on H3K27ac levels before cycle 9 and shows CUT&Tag signal distribution of this mark at three developmental time points and signal distribution of CBP, Zelda and GAF at ZGA in both wild-type and CBP-KD at cycle 14. b CUT&Tag signal of CBP and Zelda at tll locus, where both factors are bound during cycle 14 in wild-type embryos. The highlighted region indicates the localization of the Zelda motif used to predict the possible structure of binding between Zelda and CBP. c Alphafold3 predicted structure and interaction between CBP and Zelda. Secondary structures are predicted by Alphafold3 and relaxed by molecular dynamics simulations of the DBD or coiled coil regions of CBP and Zelda. The amino acid ID is indicated from N terminus to C terminus. The red and green lines sketch the protein structure of CBP and Zelda, respectively. DNA of tll locus where Zelda motif is present is coloured in blue.
Fig. 6
Fig. 6. CBP depletion impacts RNA Polymerase II dynamics by increasing its pausing state at zygotically transcribed genes.
a Profile plot and heat map of active ZGA genes identified by GRO-seq, classified as Zelda-dependent (Zld-dep), Zelda-independent (Zld-independent) according to, or non-transcribed genes (GRO-seq negative). Signal is centred around −300 bp/+5 kb from TSS. Sorting is based on GRO-seq levels and shows CUT&Tag normalized signal distribution of RNAPII-S5P and -S2P, respectively initiated and elongated isoforms of RNA Polymerase II, in both wild-type and CBP-KD at cycle 14. b Pausing index of RNAPII-S5P at Zelda-dependent, Zelda-independent and GRO-seq negative genes in both wild-type and CBP-KD condition. Boxes center refers to mean, lower and upper quartiles (Q1 and Q3, respectively). Whiskers, 1.5 × IQR below Q1 and above Q3. Two-sided Mann–Whitney U test. Zelda-dependent genes, P = 6.010 × 1008; Zelda-independent genes P = 3.141 × 10−35. n = 2 biological replicates per condition. c Genome browser snapshot of Zelda-dependent (tll) or Zelda-independent (sna) loci. CUT&Tag, nuclear RNA-seq and aggregated scATAC-seq for germ layers in wild-type (WT) and CBP-KD data are displayed. Promoter region is highlighted by a blue box, enhancer region is highlighted by a green box.
Fig. 7
Fig. 7. Multiomic dynamics of germ layer specification during ZGA in Drosophila embryos.
a Schematic of the 10× Multiome (scRNA-seq + scATAC-seq) profiling of the Drosophila ZGA embryo. b Simultaneous dissection of the chromatin landscape and transcriptomic state from each single nucleus provide a comprehensive overview of the dynamics shaping every cell of the embryo. Differential enrichment of H3K27me3 and H3K27ac at the same loci can shape different transcriptomic outputs by coordinating enhancer activation or repression, providing the blueprint for gastrulation and progression in development. Chromatin factor depletion affects enhancer regulation in two ways: depletion of maternal E(z) and H3K27me3 activate aberrant enhancers across cell-types, causing ectopic gene expression. Instead, CBP loss causes a massive block of differentiation given by the halted transcription at the pre-ZGA stage, while chromatin accessibility can still progress. In both scenarios, embryogenesis cannot be completed. E, Enhancer. P, Promoter. Adapted from an image created in BioRender. Cardamone, F. (2025) https://BioRender.com/s77z537.

References

    1. Hartenstein, V. & Campos-Ortega, J. A. Fate-mapping in wild-type Drosophila melanogaster. Wilehm Roux Arch. Dev. Biol.194, 181–195 (1985).
    1. Ciabrelli, F., Atinbayeva, N., Pane, A. & Iovino, N. Epigenetic inheritance and gene expression regulation in early Drosophila embryos. EMBO Rep.25, 4131–4152 (2024). - PMC - PubMed
    1. Illmensee, K. Developmental potencies of nuclei from cleavage, preblastoderm, and syncytial blastoderm transplanted into unfertilized eggs of Drosophila melanogaster. Wilhelm. Roux Arch. Entwickl. Mech. Org.170, 267–298 (1972). - PubMed
    1. Wieschaus, E. & Gehring, W. Clonal analysis of primordial disc cells in the early embryo of Drosophila melanogaster. Dev. Biol.50, 249–263 (1976). - PubMed
    1. Stathopoulos, A. & Newcomb, S. Setting up for gastrulation: D. melanogaster. Curr. Top. Dev. Biol.136, 3–32 (2020). - PMC - PubMed

MeSH terms