. 2025 Mar 27;11(1):59.
doi: 10.1038/s41531-025-00917-0.

Rotenone induced acute miRNA alterations in extracellular vesicles produce mitochondrial dysfunction and cell death

Affiliations

Rotenone induced acute miRNA alterations in extracellular vesicles produce mitochondrial dysfunction and cell death

Fatema Currim et al. NPJ Parkinsons Dis. .

Abstract

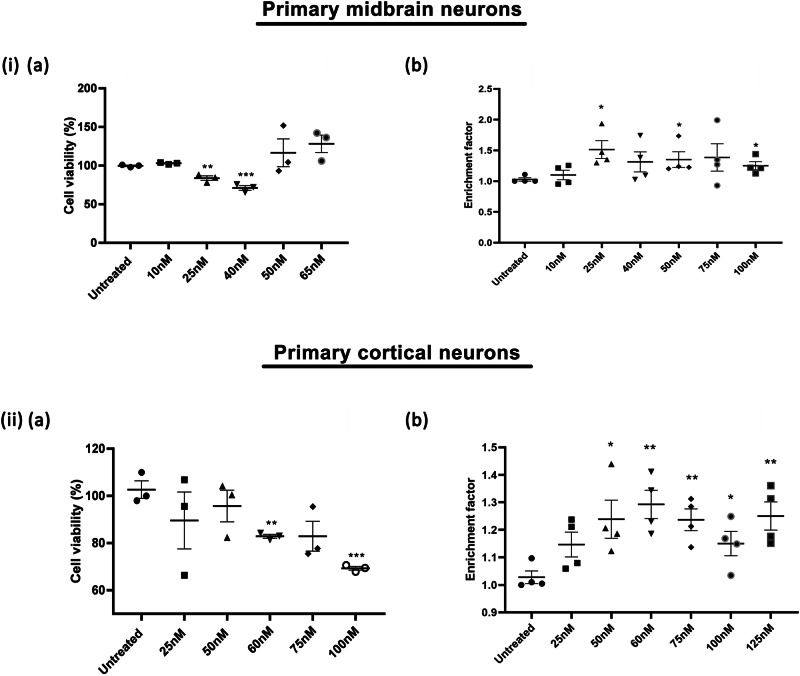
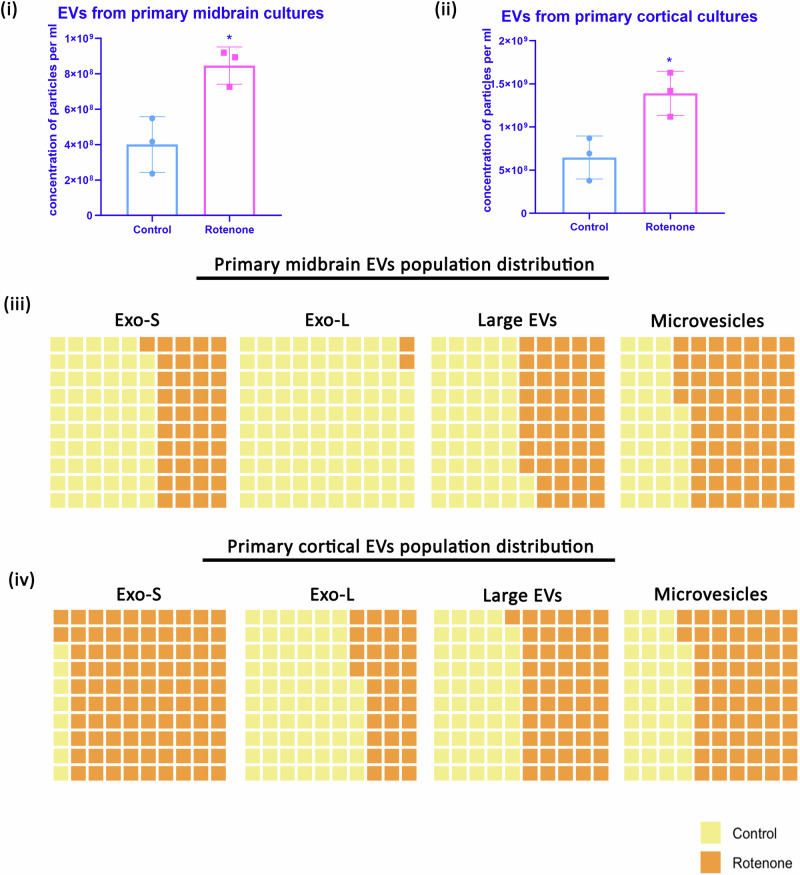
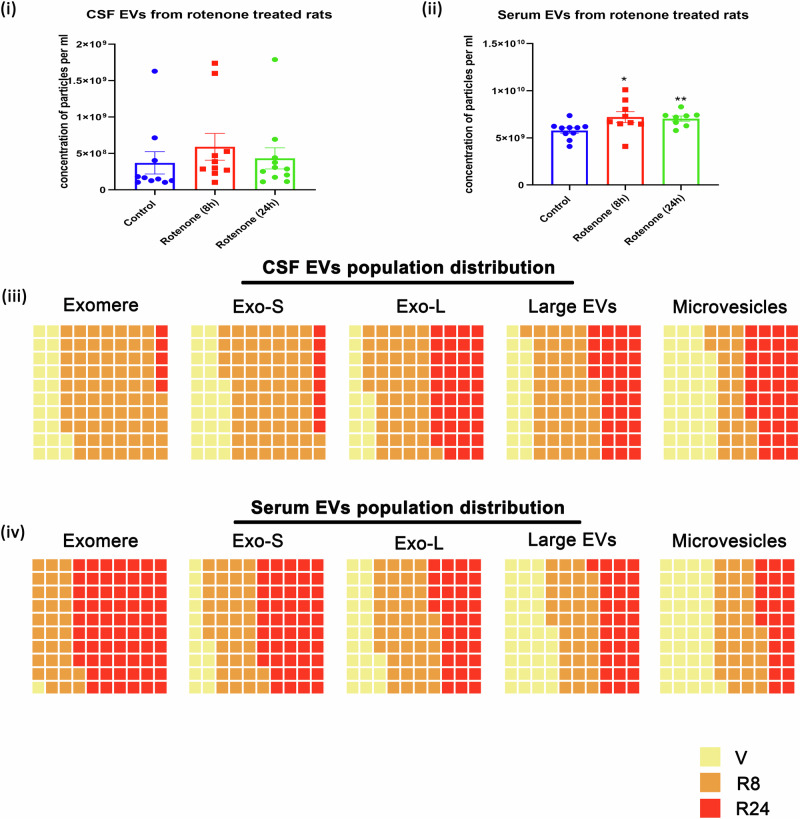
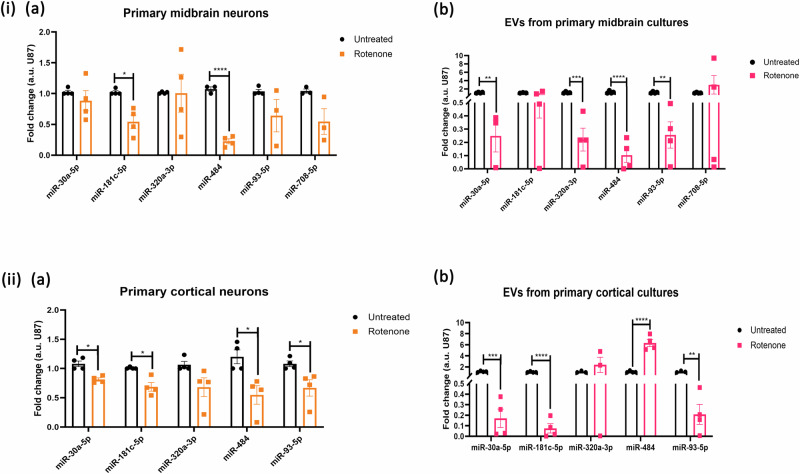
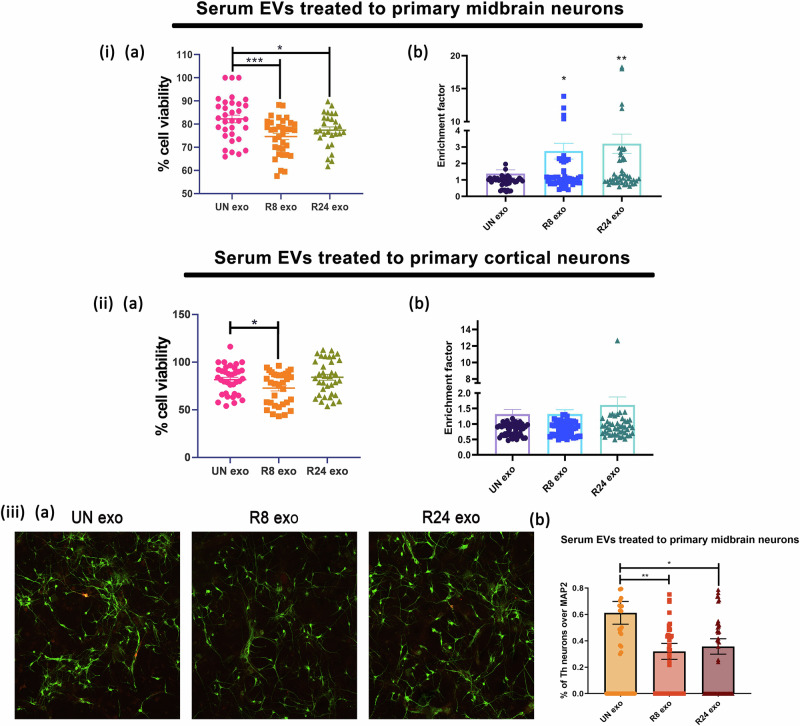
How extracellular vesicles (EVs) may contribute to mechanisms of primary intracellular pathogenesis in Parkinson's disease (PD) remains unknown. To critically advance our understanding of how EVs influence early-stage PD pathogenesis, we tested the hypothesis that rats acutely exposed to the PD neurotoxin rotenone would produce differential miRNAs in CSF/serum-derived EVs and that such modulation would be responsible for PD-relevant functional alterations in recipient neuronal cells. We discovered that acute rotenone treatment produced significant and specific serum miRNA alterations. Primary midbrain neurons treated with serum EVs from rotenone-exposed rats produced oxidative stress, mitochondrial toxicity, and cell loss in neuronal culture. These mechanisms were dependent on miR-30a-5p and miR-484. Thus, this study has elucidated that differential expression of miRNAs in circulating EVs from serum/CSF of rats is a potential early diagnostic marker for PD, and that the modulation of cellular functions and viability due to extracellular vesicles determines the pathological fate.


Conflict of interest statement

Competing interests: The authors declare no competing interests.

Figures

Fig. 1
Fig. 1. Dose-dependent toxicity of rotenone in primary neuronal cultures.
(i) Primary midbrain neurons and (ii) primary cortical neurons were treated with different doses of rotenone as mentioned above for 24 h, and cell viability was assessed by a MTT cell viability assay at 570 nm and b cell death detection by ELISA at 405 nm. Asterisk (*), (**), and (***) indicates values statistically significant from control; p value <0.05, <0.01, and <0.001 (respectively), SEM of three independent experiments, data were analyzed using one-way ANOVA, followed by Dunnett’s multiple comparisons test.
Fig. 2
Fig. 2. EV release is enhanced in primary neuronal cultures on the treatment of the PD-stress inducer rotenone.
(i) Primary midbrain neuronal cultures and (ii) primary cortical neuronal cultures were treated with 25 and 60 nM of rotenone, respectively, for 24 h and the media was collected posttreatment and subsequently EVs were isolated. The concentration of the samples were determined using nanoparticle tracking analysis (NTA), which depicts the concentration of particles per ml of solution. Asterisk (*) indicates value statistically significant from control; p value <0.05, SEM of three independent experiments, data was analyzed using Student’s t-test. (iii) Percentage distribution of the population of extracellular vesicles (EVs) derived from (iii) primary midbrain cultures (untreated vs rotenone-treated) and (iv) primary cortical cultures (untreated vs rotenone-treated).
Fig. 3
Fig. 3. EV release is enhanced in biofluids of acute rotenone-treated rat models of PD.
Rotenone was administered at an acute concentration of 3 mg/kg to Sprague-Dawley male rats of 3 months of age for 8 and 24 h, and subsequently, EVs were isolated from the (i) CSF and (ii) serum of healthy controls as well as rotenone-treated rats post-euthanasia. The concentration of the samples were determined using nanoparticle tracking analysis (NTA), which depicts the concentration of particles per ml of solution. Asterisk (*) and (**) indicates values statistically significant from control; p value <0.05 and <0.01 (respectively), SEM of ten independent values, data were analyzed using Student’s t-test. (iii) Waffle chart depicting percentage distribution of the population of extracellular vesicles (EVs) derived from CSF and (iv) serum of acute-rotenone-exposed rats.
Fig. 4
Fig. 4. EV-miRNA levels are altered in primary neuronal cells and EVs on treatment with rotenone.
(i) Primary midbrain cultures and (ii) Primary cortical cultures were treated with 25 and 60 nM rotenone, respectively, for 24 h and subsequently EVs were isolated and differential expression of miRNAs were checked in a total cells and b EVs by RT-qPCR. Asterisk (*), (**), (***), and (****) indicates values statistically significant from control; p value <0.05, <0.01, <0.001, and <0.0001 (respectively), SEM of three or four independent experiments, data were analyzed using one-way ANOVA, followed by Dunnett’s multiple comparisons test.
Fig. 5
Fig. 5. EV-miRNAs are differentially expressed in biofluids of rotenone-treated rat models of PD.
Acute rotenone toxicity was administered to young adult male Sprague-Dawley rats of 3 months of age at a concentration of 3 mg/kg for 8 and 24 h. Biofluids were subsequently collected from the rats post-euthanasia and EVs were isolated from the biofluids. The differential expression of EV-miRNAs in the (i) CSF and (ii) serum were determined by RT-qPCR. Asterisk (*), (**), (***), and (****) indicates values statistically significant from control; p value <0.05, <0.01, <0.001, and <0.0001 (respectively), SEM of ten independent experiments, data were analyzed using one-way ANOVA, followed by Dunnett’s multiple comparisons test.
Fig. 6
Fig. 6. Serum EVs alter mitochondrial functions in primary rat cortical and midbrain neurons.
Serum EVs derived from rotenone-treated rats were incubated with primary midbrain ((i) and (ii)) and cortical neurons ((iii) and (iv)), and total cellular ROS was determined by DCFDA, and mitochondrial ROS was assessed using MitoSox staining. UN exo: serum EVs derived from healthy rats, R8 exo: serum EVs derived from rats exposed to rotenone for 8 h, R24 exo: serum EVs derived from rats exposed to rotenone for 24 h. Each independent experiment consisted of a 96-well plate of primary culture, with each well treated with serum EVs from a different animal, resulting in an “n” of 12 per experiment. Five independent experiments were conducted, leading to a total n = 60. Asterisk (*) and (**) indicates values statistically significant from control; p value <0.05 and <0.01 (respectively), SEM of five independent experiments, data were analyzed using one-way ANOVA, followed by Dunnett’s multiple comparisons test.
Fig. 7
Fig. 7. Serum EVs from acute rotenone-treated rat models of PD decrease the cell viability of primary rat cortical and midbrain neurons.
Serum EVs from rotenone-treated rat models of PD at both 8 and 24 h were incubated with primary neurons at a concentration of 50 μg/mL. Posttreatment, the cell viability was assessed in (i) primary midbrain neurons and (ii) primary cortical neurons by using a MTT cell viability assay and b cell death detection by DNA damage ELISA. (iii) a Serum EVs were treated to primary midbrain neurons as mentioned above, and the cells were fixed posttreatment, and immunocytochemistry was performed in the cells using TH (red) for specific dopaminergic neurons and MAP2 (green) as a general neuronal marker, and the cells were observed using confocal microscopy (merged image is displayed) and b % quantification of TH neurons over MAP2 was calculated by counting the cells using Nikon analysis software. The scale bar represents 100 µm. A minimum of 10 fields per well were considered, analyzing over 200 cells per field. UN exo: serum EVs derived from healthy rats, R8 exo: serum EVs derived from rats exposed to rotenone for 8 h, R24 exo: serum EVs derived from rats exposed to rotenone for 24 h. Each independent experiment consisted of a 48-well plate of primary culture, with each well treated with serum EVs from a different animal, resulting in an “n” of 6–12 per experiment. Three to five independent experiments were conducted, leading to a total n = 30–36. Asterisk (*), (**), and (***) indicates values statistically significant from control; p value <0.05, <0.01, and <0.001 (respectively), SEM of three and five independent experiments, data were analyzed using one-way ANOVA, followed by Dunnett’s multiple comparisons test.
Fig. 8
Fig. 8. R8 exo from serum of acute rotenone-treated rat models of PD elicit cell death in primary rat midbrain cultures pretreated with rotenone.
Serum EVs from rotenone-treated rat models of PD at 8 h were incubated with primary neurons pretreated with 25 nM rotenone at a concentration of 50 µg/mL. Posttreatment, cell viability was assessed using (i) MTT cell viability assay and (ii) cell death detection by DNA damage ELISA. (iii) a Serum EVs were treated to primary midbrain neurons as mentioned above, and the cells were fixed posttreatment and immunocytochemistry was performed in the cells using TH (red) for specific dopaminergic neurons and HuC (green) as a general neuronal marker, and the cells were observed using confocal microscopy (merged image is displayed) and b % quantification of TH neurons over HuC was calculated by counting the cells using Nikon analysis software. The scale bar represents 100 µm. A minimum of 10 fields per well were considered, analyzing over 200 cells per field. UN exo: serum EVs derived from healthy rats, R8 exo: serum EVs derived from rats exposed to rotenone for 8 h. Each independent experiment consisted of a 96-well plate of primary culture, with each well treated with serum EVs from a different animal, resulting in an “n” of 6–8 per experiment. Three independent experiments were conducted, leading to a total n = 24–36. Asterisk (*), (***), and (****) indicates values statistically significant from control; p value <0.05, <0.001, and <0.0001 (respectively), SEM of three independent experiments, data were analyzed using two-way ANOVA, followed by Sidak’s and Tukey’s multiple comparisons test.
Fig. 9
Fig. 9. miR-30a-5p and miR-484 alleviate rotenone-induced toxic effects in SH-SY5Y cells.
SH-SY5Y cells were transfected with control mimic (CM) and miR-30a-5p or miR-484 mimics and were subsequently treated with 50 nM rotenone. a Total cellular ROS levels were quantified using DCFDA staining, and b mitochondrial ROS levels were assessed by MitoSox staining. The cellular viability was assessed using c MTT assay and d DNA damage ELISA. Asterisk (*), (**), and (****) indicates values statistically significant from control; p value <0.05, <0.01, and <0.0001 (respectively), SEM of eight independent experiments, data were analyzed using two-way ANOVA, followed by Tukey’s multiple comparisons test.

References

    1. Bloem, B. R., Okun, M. S. & Klein, C. Parkinson’s disease. Lancet397, 2284–2303 (2021). - PubMed
    1. Armstrong, M. J. & Okun, M. S. Diagnosis and treatment of Parkinson disease: a review. JAMA323, 548 (2020). - PubMed
    1. Oertel, W. & Schulz, J. B. Current and experimental treatments of Parkinson disease: a guide for neuroscientists. J. Neurochemistry139, 325–337 (2016). - PubMed
    1. Gibb, W. R. & Lees, A. J. The relevance of the Lewy body to the pathogenesis of idiopathic Parkinson’s disease. J. Neurol. Neurosurg. Psychiatry51, 745–752 (1988). - PMC - PubMed
    1. Jamebozorgi, K. et al. Cellular and molecular aspects of Parkinson treatment: future therapeutic perspectives. Mol. Neurobiol.56, 4799–4811 (2019). - PubMed

LinkOut - more resources