. 2025 Mar 27;16(1):2989.
doi: 10.1038/s41467-025-58317-0.

SIRT7 facilitates endometrial cancer progression by regulating PTEN stability in an estrogen-dependent manner

Affiliations

SIRT7 facilitates endometrial cancer progression by regulating PTEN stability in an estrogen-dependent manner

Zhiyi Hu et al. Nat Commun. .

Abstract

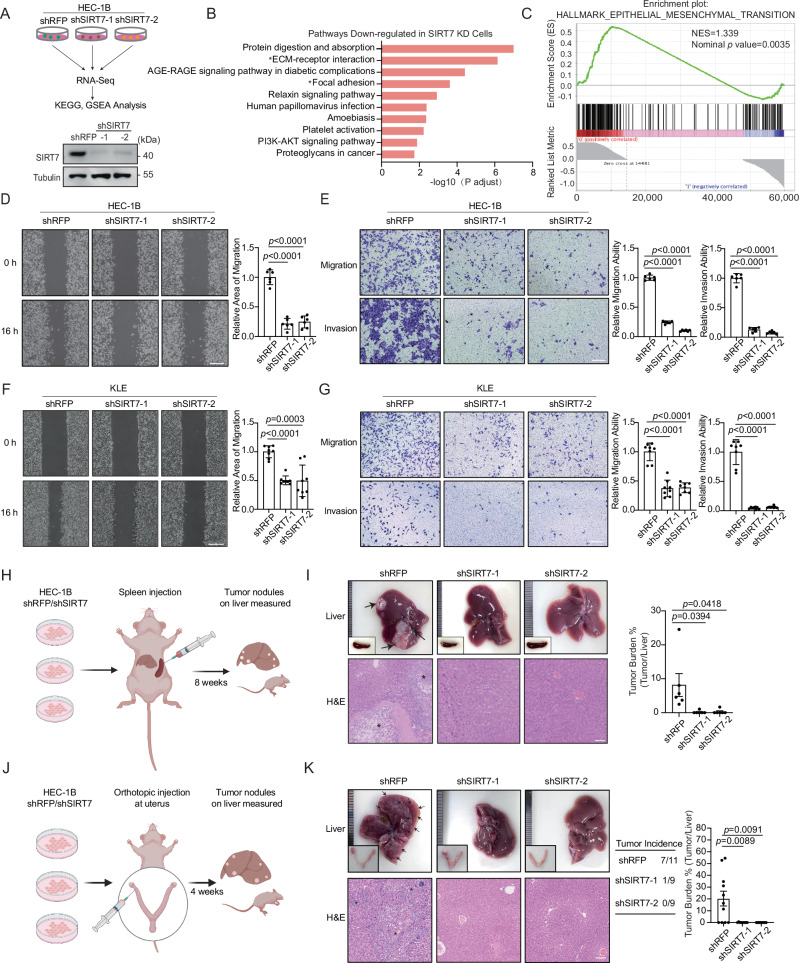
The prognosis of metastatic endometrial carcinoma (EC), one of the most common gynecological malignancies worldwide, remains poor, and the underlying driver of metastases is poorly understood. Dysregulation in estrogen-related signaling and inactivation of tumor suppressor PTEN are two essential risk factors of EC. However, whether and how they are interconnected during EC development remains unclear. Here, we demonstrate that the deacetylase SIRT7 is upregulated in EC patients and mouse models, facilitating EC progression in vitro and in vivo. Mechanistically, in an estrogen-dependent fashion, SIRT7 mediates PTEN deacetylation at K260, promoting PTEN ubiquitination by the E3 ligase NEDD4L, accelerating PTEN degradation and, consequently, expediting EC metastasis. Additionally, SIRT7 expression strongly correlates with poor survival in EC patients with wild-type PTEN, though no significant correlation is observed in PTEN mutation patients. These results lay the foundation for the study of targeting estrogen-SIRT7-PTEN axis, to restore PTEN abundance, offering potential avenues for EC therapy.


Conflict of interest statement

Competing interests: The authors declare no competing interests.

Figures

Fig. 1
Fig. 1. High expression of SIRT7 is positively associated with endometrial cancer progression.
A SIRT7 expression analysis of normal endometrium tissue (n = 35) and endometrial cancer tissue (n = 544), data from TCGA. B SIRT7 expression analysis of endometrial cancer in grade 1–2 and high grade, data from TCGA (left, G1/G2 n = 218, High Grade n = 326), data from GSE115810 (right, G1/G2 n = 18, High Grade n = 6). C SIRT7 expression analysis of human EC tissue by IHC. Endometrial cancer and paired para-tumor tissues (tumor n = 21, para-tumor n = 18) were stained with SIRT7 and quantified by IHC score. Scale bar = 50 μm. D SIRT7 expression analysis by Western blot. Tissues of paired endometrial cancer with adjacent normal tissue (n = 10) were analyzed for SIRT7 expression and quantified. The relative expression level was calculated by SIRT7/GAPDH. ImageJ software was used. E SIRT7 expression analysis of human EC tissue by IHC. Primary tumor tissue of EC and paired metastatic tissues in ovary or fallopian tube (n = 13) were stained with SIRT7 and quantified by IHC score. Scale bar = 50 μm. F SIRT7 expression analysis of human EC tissue by IHC. Primary tumor tissue of EC and paired metastasis tissues in lymph nodes (n = 15) were stained with SIRT7 and quantified by IHC score. Scale bar = 50 μm. G The diagram of Lkb1f/f mice crossed with Pgr-Cre mice. H The representative photograph, H&E staining and immunohistochemistry staining of uterus tissue of Lkb1 CKO (Lkb1f/f Pgr-Cre) mice and control mice (Lkb1f/f) at different weeks post birth (n = 5). Scale bar = 50 μm. I Western blot analysis of the uterus tissue of Lkb1 CKO mice and control mice at six weeks post birth. Different EC tumor nodules of Lkb1 CKO mice were isolated and analyzed (n = 6). Relative Sirt7 expression was quantified by Sirt7/Tubulin. The P value was calculated with two tailed unpaired t test for (AC, I) and calculated with two tailed paired t test for (DF). Data are presented as mean values ± s.e.m.
Fig. 2
Fig. 2. SIRT7 accelerates endometrial cancer metastasis.
A The schematical process of RNA-Sequencing. Differentially expressed genes based on the RNA-Seq results were analyzed by KEGG enrichment (B) and GSEA enrichment (C). D Representative images of wound healing assay for HEC-1B cells with or without SIRT7 knockdown. The area of migration was calculated in six random views and normalized by shRFP group, scale bar = 500 μm, n = 6, cell cultures from three independent experiments. E Representative images of transwell assay and invasion assay for HEC-1B cells with or without SIRT7 knockdown. Cell number of six random views and normalized to control for migration or invasion ability quantification, scale bar = 200 μm, n = 6, cell cultures from three independent experiments. F Wound healing assay for KLE cells with or without SIRT7 knockdown, n = 3, cell cultures from three independent experiments, scale bar = 500 μm. G Transwell assay and invasion assay for KLE cells with or without SIRT7 knockdown, n = 4, cell cultures from four independent experiments, scale bar = 200 μm. H Diagram of the construction of a liver metastasis mouse model. Created in BioRender. Hu, Z. (2025) https://BioRender.com/f78p401. I Representative images of the mice liver, spleen and H&E-stained liver demonstrating the normal liver tissue and metastasis nodules in spleen injection assay. The metastasis area was marked with asterisks and arrows, scale bar = 100 μm. Tumor burden analysis was calculated by tumor area/liver area identified by H&E staining, n = 6. J Diagram of the uterus orthotopic injection mouse model. Created in BioRender. Hu, Z. (2025) https://BioRender.com/m69e532. K Representative images of the mice liver, uterus and H&E-stained liver in uterus orthotopic injection assay. The incidence of metastasis nodules occurred on liver was shown in the table and the tumor burden was calculated. shRFP group n = 11, shSIRT7-1 group n = 9, shSIRT7-2 group n = 9, scale bar = 100 μm. Data are presented as mean values ± s.d. for (DG), and ±s.e.m. for (I, K). The P value was calculated with two tailed unpaired t test.
Fig. 3
Fig. 3. SIRT7 interacts with and directly deacetylates PTEN.
A, B Co-IP assays of the interaction of GFP-HA-PTEN and FLAG-SIRT7 in HEK293FT cells. GFP-HA-PTEN and FLAG-SIRT7 were overexpressed in HEK293FT cells and immunoprecipitants were enriched with anti-HA (A) antibodies or anti-FLAG (B) antibodies. C Endogenous Co-IP assays of the interaction between SIRT7 and PTEN using antibodies against PTEN in HEK293FT cells (upper) and HEC-1B cells (lower). D GST-pulldown assay. Purified GST-PTEN, GST proteins were harvest with purified HIS-SIRT7 and precipitated with anti-GST antibodies then subjected to immunoblots. E Truncations of GST-SIRT7 were constructed and the truncation proteins were harvested with FLAG-PTEN and precipitated with anti-GST antibodies. F Truncations of GST-PTEN were constructed and the truncation proteins were harvested with FLAG-SIRT7 and precipitated with anti-GST antibodies. G Acetylation level of PTEN in HEK293FT cells while SIRT7-WT or SIRT7-H187Y was overexpressed. The pan-Acetyl antibodies were used to detect the acetylation level of PTEN after immunoprecipitation. H Acetylation level of PTEN in HEK293FT cells with or without SIRT7 knockdown in HEK293FT cells. I Acetylation level of PTEN in HEK293FT cells. For HEK293FT cells, SIRT7 were knockdown and then FLAG-SIRT7 was re-expressed. J, K The immunoblots showing the acetylation level of PTEN in vitro. FLAG-SIRT7 and HA-PTEN was purified by antibodies from cell lysates. PTEN acetylation level was detected by pan-acetylation antibodies after harvesting with or without SIRT7, NAD+ and NAM as indicated. L Immunoblots showing acetylation level of WT-PTEN and KR mutants (K60R, K223R, K260R, K344R, 4KR), detected by pan-acetyl antibodies after immunoprecipitation. To ensure similar expression levels among various PTEN-mut-plasmids, plasmids of different volumes are transfected. M Amino acid sequences of PTEN (aa251-264) of human, mouse, rat, and dog. N Immunoblots showing acetylation levels of WT PTEN and PTEN-K260R in vitro after incubation with or without SIRT7 and NAD+, detected by pan-AcK antibodies. O Immunoblots showing PTEN-K260 acetylation levels of PTEN-WT/K260R/K260Q after immunoprecipitation. The PTEN-K260 acetylation level was detected by AcK260-PTEN specific antibody after immunoprecipitation. P Immunoblots showing the K260 acetylation level of endogenous PTEN after immunoprecipitation in sgSIRT7 (pool) or sgScramble HEK293FT cells. The PTEN-K260 acetylation level was detected by AcK260-PTEN specific antibody.
Fig. 4
Fig. 4. SIRT7-mediated PTEN deacetylation is associated with PTEN instability.
AC PTEN protein level shown by immunoblots and quantification analysis of three independent repeats (n = 3). SIRT7 was knocked down (A), otherwise SIRT7 (B) or SIRT7-WT/H187Y (C) was overexpressed in HEC-1B cells. The relative expression level was analyzed in Image J, calculated by PTEN/Tubulin, and normalized by the control lane. The P value was calculated with two tailed unpaired t test. D The immunoblots showing the half-life of protein PTEN in HEC-1B cells with or without SIRT7 knockdown and the quantitative analysis of three independent repeats (n = 3). HEC-1B cells were treated with CHX (100 μg/ml) for indicated time and subjected for immunoblot analysis. HEC-1B shSIRT7 stable cell line was used and relative PTEN protein level was analyzed in Image J, calculated by PTEN/Tubulin, and normalized by the lane ‘0 h’. E Immunoblots showing the half-life of protein PTEN in HEC-1B cells over-expressing SIRT7-WT or SIRT7-H187Y and quantitative analysis (n = 3). F Immunoblots showing the half-life of protein PTEN-WT or PTEN-K260Q overexpressed in HEC-1B cells and quantitative analysis (n = 3). Two-way ANOVA was used for the P value calculation for (DF). G Representative images of the mice uterus in immunofluorescence assay. The frozen sections of mice uterus tissue from control mice (Sirt7f/f) and Sirt7 uterus CKO mice (Sirt7f/f Pgr-cre) (n = 3) were stained with SIRT7, PTEN and DAPI. Scale bar = 50 μm. H Representative images of IHC staining of the uterus tissue from control mice (Sirt7f/f) and Sirt7 uterus CKO mice (Sirt7f/f Pgr-cre) (n = 5). The uterus tissue of the indicated mice was stained with SIRT7, PTEN, AcK260-PTEN antibodies. Scale bar = 50 μm. Data are presented as mean values ± s.e.m.
Fig. 5
Fig. 5. PTEN-K260 deacetylation by SIRT7 contributes to NEDD4L-mediated ubiquitination.
A Immunoblot manifesting PTEN protein level and the quantitative analysis for three repeats (n = 3). SIRT7 was overexpressed in HEC-1B cells, and the cells were treated with DMSO or MG132 (10 μM, 8 h) or CHQ (20 μM, 16 h) before being collected. The error bars indicate the s.e.m. values. The P value was calculated with two tailed unpaired t test. B Ubiquitination level of PTEN with or without SIRT7 overexpression in HEK293FT cells. C Ubiquitination level of PTEN in sgSIRT7 (pool) or sgScramble HEK293FT cells. D Ubiquitination level of PTEN-WT/ K260Q/ K260R. For BD, the HA-Ub and FLAG-EV, FLAG-PTEN-WT/K260Q/K260R were overexpressed in HEK293FT cells as indicated, and the ubiquitination level was detected after immunoprecipitation. E Mass spectrum results suggesting the E3 ligase interacting with PTEN and ranked by number of unique peptides. F PTEN protein level shown by immunoblots after NEDD4L knockdown. NEDD4L was deleted in HEC-1B cells by short hairpin RNAs. G Ubiquitination level of FLAG-PTEN after NEDD4L knockdown. HA-Ub and FLAG-PTEN were over expressed, and the ubiquitination level was detected after immunoprecipitation. H Ubiquitination level of FLAG-PTEN after NEDD4L knockdown and SIRT7-Myc overexpression. HA-Ub and FLAG-PTEN were over expressed, and the ubiquitin level was detected after immunoprecipitation. I Co-IP manifesting the interaction between endogenous NEDD4L and PTEN after Myc-SIRT7 overexpression in HEK293FT cells. J Co-IP manifesting the interaction between endogenous NEDD4L and PTEN-WT/K260Q after Myc-SIRT7 overexpression in HEK293FT cells.
Fig. 6
Fig. 6. PTEN-K260 deacetylation by SIRT7 promotes endometrial cancer metastasis.
A Wound healing assay in HEC-1B-rescue cells. For HEC-1B-rescue cells, PTEN was knocked down and empty vector, rPTEN-WT, rPTEN-K260Q or rPTEN-K260R was expressed. Relative area of migration was measured and normalized to the ‘EV’ group, n = 6, cell cultures from three independent experiments, scale bar = 500 μm. B Transwell and invasion assay in HEC-1B-rescue cells. Relative cell number was quantified, n = 8, cell cultures from four independent experiments, scale bar = 200 μm. C Wound healing assay in HEC-1B cells. SIRT7 was overexpressed and then PTEN-WT, PTEN-K260Q or empty vector was then expressed, n = 6, cell cultures from three independent experiments, scale bar = 500 μm. D Transwell and invasion assay in HEC-1B cells. SIRT7 was overexpressed and then PTEN-WT, PTEN-K260Q or empty vector was then expressed, n = 8, cell cultures from three independent experiments, scale bar = 200 μm. E Representative images of the mice liver, spleen, and H&E-stained liver after the injection of HEC-1B-rescue cells into the spleen. Tumor burden was calculated, EV group n = 12, rPTEN-K260Q/rPTEN-K260R group n = 10, scale bar = 100 μm, metastasis nodules marked with asterisks. F Representative images of the mice liver, uterus, and H&E-stained liver, n = 6, scale bar = 100 μm. The incidence of liver metastasis nodules was shown and tumor burden was calculated. G AcK260-PTEN level analysis of human EC tissue by IHC. Primary tumor and paired metastasis tissue (in ovary/fallopian, n = 13) or metastatic lymph nodes (n = 15) were stained with AcK260-PTEN and quantified by IHC score. Scale bar = 50 μm H AcK260-PTEN level analysis of human EC tissue by IHC. Tumor (n = 21) and paired para-tumor tissue (n = 18) were stained with AcK260-PTEN, and quantified by IHC score. Scale bar = 50 μm. The P value was calculated with two tailed unpaired t test for (AF, H), and was calculated with two tailed paired t test for (G). I Kaplan–Meier overall survival analysis of EC patients with or without PTEN mutation, data from the TCGA, n = 175 for PTEN-WT (SIRT7 high = 117; SIRT7 low = 58), n = 332 for PTEN-mut (SIRT7 high = 222; SIRT7 low = 110). Cut-off = 0.33. Data are presented as mean values ± s.d. for (AD), and ± s.e.m. for (EH).
Fig. 7
Fig. 7. Estrogen acts as the upstream regulator of SIRT7-PTEN axis.
A Immunoblots showing PTEN level after the cells being treated with 17 beta-Estradiol (E2) for 48 hours with indicated concentration in HEC-1B cells. B Immunoblots showing PTEN level after estrogen treatment for 48 hours with indicated concentration in HEC-1B cells with or without SIRT7 knockdown. C Representative pictures and quantitative analysis of PLA assay demonstrating the interaction of endogenous PTEN and SIRT7 protein with or without E2 stimulation. HEC-1B cells were treated with E2 (100 nM, 48 h) and MG132 (10 μM, 6 h) as indicated. 100 cells were quantified. Scale bar = 100 μm. D Co-IP assay manifesting the interaction between endogenous SIRT7 and PTEN in HEC-1B cells with E2 stimulation for 48 hours with indicated concentration. E Co-IP assay manifesting the interaction between SIRT7 and PTEN in HEK293FT with E2 stimulation for 48 hours with indicated concentration. F Co-IP assay manifesting the interaction between SIRT7 and PTEN after ESR1 overexpression in HEK293FT cells. G The acetylation level of PTEN in HEK293FT cells with stimulation of E2 (50 nM, 48 h) with or without SIRT7 overexpression. H The AcK260 level of endogenous PTEN in HEC-1B cells with or without stimulation of E2 (100 nM, 48 h) detected by AcK260-PTEN antibody. I Co-IP assay manifesting the interaction between endogenous NEDD4L and PTEN in HEK293FT with SIRT7 overexpression and E2 stimulation as indicated in HEK293FT cells. J The ubiquitination level of PTEN in HEK293FT cells with stimulation of E2 of indicated concentration. Cells were treated with MG132 (10 μm) for 6 hours before lysis. AcK260-PTEN (K) and SIRT7 (L) analysis of human uterus endometrium tissue during menstrual cycle by IHC. Endometrium in secretory phase (n = 12) and proliferative phase (n = 17) were stained with AcK260-PTEN and SIRT7 and quantified by IHC score. Scale bar = 50 μm. M Schematic diagram showing the mechanisms that SIRT7 upregulation facilitates EC progression through PTEN-K260 deacetylation and subsequent ubiquitination and degradation under long-term stimulation of estrogen. Created in BioRender. Hu, Z. (2025) https://BioRender.com/d55g597. The P value was calculated with two tailed unpaired t test for (C, K, L). Data are presented as mean values ± s.e.m.

References

    1. Siegel, R. L., Miller, K. D., Fuchs, H. E. & Jemal, A. Cancer statistics, 2022. CA Cancer J. Clin.72, 7–33 (2022). - PubMed
    1. Siegel, R., Naishadham, D. & Jemal, A. Cancer statistics, 2012. CA Cancer J. Clin.62, 10–29 (2012). - PubMed
    1. Lu, K. H. & Broaddus, R. R. Endometrial cancer. N. Engl. J. Med.383, 2053–2064 (2020). - PubMed
    1. O’Malley, D. M. et al. Pembrolizumab in patients with microsatellite instability-high advanced endometrial cancer: results from the KEYNOTE-158 study. J. Clin. Oncol.40, 752–761 (2022). - PMC - PubMed
    1. Makker, V. et al. Lenvatinib plus pembrolizumab for advanced endometrial cancer. N. Engl. J. Med.386, 437–448 (2022). - PMC - PubMed

LinkOut - more resources