. 2025 Mar 27;16(1):3012.
doi: 10.1038/s41467-025-58301-8.

Medium from human iPSC-derived primitive macrophages promotes adult cardiomyocyte proliferation and cardiac regeneration

Affiliations

Medium from human iPSC-derived primitive macrophages promotes adult cardiomyocyte proliferation and cardiac regeneration

Yi Xiao et al. Nat Commun. .

Abstract

Heart injury has been characterized by the irreversible loss of cardiomyocytes comprising the contractile tissues of the heart and thus strategies enabling adult cardiomyocyte proliferation are highly desired for treating various heart diseases. Here, we test the ability of human induced pluripotent stem cell-derived primitive macrophages (hiPMs) and their conditioned medium (hiPM-cm) to promote human cardiomyocyte proliferation and enhance cardiac regeneration in adult mice. We find that hiPMs promote human cardiomyocyte proliferation, which is recapitulated by hiPM-cm through the activation of multiple pro-proliferative pathways, and a secreted proteome analysis identifies five proteins participating in this activation. Subsequent in vivo experiments show that hiPM-cm promotes adult cardiomyocyte proliferation in mice. Lastly, hiPM-cm enhances cardiac regeneration and improves contractile function in injured adult mouse hearts. Together, our study demonstrates the efficacy of using hiPM-cm in promoting adult cardiomyocyte proliferation and cardiac regeneration to serve as an innovative treatment for heart disease.


Conflict of interest statement

Competing interests: The authors declare no competing interests.

Figures
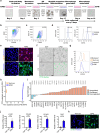
Fig. 1
Fig. 1. Generation of hiPSC-derived primitive macrophages.
a Schematic diagram of the protocols to generate hiPMs from human iPSCs. Relevant growth factors and duration of differentiation steps are as indicated. Cartoon elements used in the schematic diagram were created using BioRender. b Flow cytometry analysis of cells double positive for KDR and CD235 during hemogenic epithelium (HE) specification at day 5 after the start of hiPM differentiation. c Flow cytometry analysis of cells positive for CD45 during myeloid progenitor generation at day 11 after the start of hiPM differentiation. d Flow cytometry analysis of hiPMs positive for CD11b and CD14 at day 32 after the start of hiPM differentiation. e Immunofluorescence images for CD11b and CD14 expression in hiPMs. iPSCs were used as a negative control. Cells were stained with CD11b (red) and CD14 (green); nuclei were counterstained with Hoechst (blue). Scale bar, 10 µm. The experiment was repeated three times independently with similar results. f Phagocytosis assessment of hiPMs with FITC-conjugated Dextran (green). Human iPSC-derived cardiac fibroblasts (hiCFs) were used as a negative control. Scale bar, 50 μm. g Flow cytometry analysis of CCR2 expression in hiPMs. THP-1Ms were used as a positive control. The experiment was repeated three times independently with similar results. h Principal component analysis of RNA sequencing data revealing in-group clusters with minimal overlap between hiPMs and THP-1Ms. n = 4 biological repeats per group. i Barplot of differentially expressed genes (hiPMs vs THP-1Ms) specific to primitive macrophages. Differentially expressed genes were identified with a cutoff of |Fold change | > 2 and adjusted p-value < 0.05. j Measurement of LYVE1, FOLR2, CD163, and MAF mRNA levels in hiPMs and THP-1Ms via qPCR analysis. β-actin was used as a control. n = 3 biological repeats per group. k Representative immunofluorescence images for LYVE1 expression in hiPMs. THP-1Ms were used as a negative control. Cells were stained with LYVE1 (green); nuclei were counterstained with Hoechst (blue). Scale bar, 20 μm. Quantitative data are presented as the mean ± SEM. Groups were compared using a two-tailed unpaired Student’s t test (j) or ANOVA (i). Source data are provided as a Source Data file.
Fig. 2
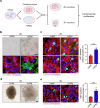
Fig. 2. HiPMs promote human cardiomyocyte proliferation.
a Schematic diagram depicting the co-culture of human cardiomyocytes and hiPMs in 2D and 3D culture systems. Cartoon elements used in the schematic diagram were created using BioRender. b Images showing co-culturing of human cardiomyocytes and hiPMs by brightfield microscopy and immunofluorescence microscopy. Human cardiomyocytes co-cultured with hiPMs (+hiPM) were compared with human cardiomyocytes alone (-hiPM). For immunofluorescence images, human cardiomyocytes were labeled with cardiac Troponin T (cTnT) (red), hiPMs were labeled with CD14 (green), and all the nuclei were counterstained with Hoechst (blue). Scale bars, 100 μm for brightfield images and 10 μm for immunofluorescence images. The experiment was repeated three times independently with similar results. c Representative immunofluorescence images and quantification of Ki67-positive human cardiomyocytes co-cultured with hiPMs in a 2D culture system. Human cardiomyocytes were labeled with cTnT (red) and Ki67 (green); cardiomyocyte nuclei were counterstained with Hoechst (blue). Scale bar, 10 μm. n = 3 biological repeats per group. d Brightfield images showing the co-culturing of human cardiomyocytes and hiPMs in 3D culture system. Human cardiomyocytes co-cultured with hiPMs (+hiPM) were compared with human cardiomyocytes alone (-hiPM) at 10 days after the start of 3D culturing in Ultralow attachment 96 U-well plates. Scale bar, 100 μm. The experiment was repeated three times independently with similar results. e Representative immunofluorescence images and quantification of Ki67-positive human cardiomyocytes co-cultured with hiPMs in the 3D culture system. Human cardiomyocytes were labeled with cTnT (red) and Ki67 (green); cardiomyocyte nuclei were counterstained with Hoechst (blue). Scale bar, 15 μm. n = 3 biological repeats per group. Quantitative data are presented as the mean ± SEM. Groups were compared using a two-tailed unpaired Student’s t test (c and e). Source data are provided as a Source Data file.
Fig. 3
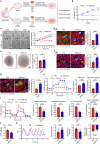
Fig. 3. HiPM-cm promotes human cardiomyocyte proliferation.
a Schematic diagram depicting the incubation of human cardiomyocytes with fresh culture medium (FM group) or conditioned medium collected from hiPMs (hiPM group). Cartoon elements used in the schematic diagram were created using BioRender. b Daily cell count in human cardiomyocytes treated with FM or hiPM-cm for 4 days. n = 4 per group. c Cardiomyocyte proliferation monitored by IncuCyte instrument at a 12 h interval for 4 days. n = 4 per group. Scale bar, 50 μm. d Immunofluorescence staining of Ki67-positive human cardiomyocytes treated with FM and hiPM-cm in 2D culture system. Human cardiomyocytes were labeled with cTnT (red) and Ki67 (green); nuclei were counterstained with Hoechst (blue). Scale bar, 10 μm. n = 3 biological repeats per group. e Cross-sectional areas of cardiac spheres composed of human cardiomyocytes treated with FM and hiPM-cm at 10 days after the start of 3D culturing. Scale bar, 100 μm. n = 8 spheres for FM group, n = 7 spheres for hiPM-cm group. f Immunofluorescence staining of Ki67-positive human cardiomyocytes treated with FM and hiPM-cm in the 3D culture system. Human cardiomyocytes were labeled with cTnT (red) and Ki67 (green); nuclei were counterstained with Hoechst (blue). Scale bar, 15 μm. n = 3 biological repeats per group. g Immunofluorescence staining of αSMA-positive human cardiomyocytes treated with FM and hiPM-cm. Human cardiomyocytes were labeled with cTnT (red) and αSMA (green); nuclei were counterstained with Hoechst (blue). Scale bar, 10 μm. n = 3 biological repeats per group. h Extracellular acidification rate (ECAR) analysis in human cardiomyocytes treated with FM and hiPM-cm. n = 4 biological repeats per group. i Oxygen consumption rate (OCR) analysis in human cardiomyocytes treated with FM and hiPM-cm. n = 3 biological repeats per group. j ATP levels in human cardiomyocytes treated with FM and hiPM-cm. n = 6 biological repeats per group. k Calcium handling analysis in human cardiomyocytes treated with FM and hiPM-cm. n = 12 cardiomyocytes per group. Quantitative data are presented as the mean ± SEM. Groups were compared using a two-tailed unpaired Student’s t test (bk). Source data are provided as a Source Data file.
Fig. 4
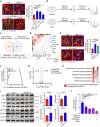
Fig. 4. Proteomics analysis of hiPM-cm reveals protein components involved in the activation of multiple pro-proliferative signaling pathways.
a Immunofluorescence staining of Ki67-positive human cardiomyocytes treated with FM, hiPM-cm, hiPM-cm components retained by or passing through 3-kDa filters. Human cardiomyocytes were labeled with cTnT (red) and Ki67 (green); nuclei were counterstained with Hoechst (blue). Scale bar, 10 μm. n = 3 biological repeats per group. b Experimental strategy for analyzing protein components from hiPMpre-cm or hiPM-cm collected in RPMI medium by LC/MS. Cartoon elements used in the schematic diagram were created using BioRender. c Venn diagram showing the overlap between upregulated proteins identified in hiPM-cm versus hiPMpre-cm by LC/MS and upregulated genes encoding secreted proteins in CCR2- human cardiac tissue-resident macrophages versus CCR2+ human monocyte-derived macrophages in the heart. d Unsupervised clustering analysis of relative pro-proliferative potentials of pairwise protein combinations evaluated by the percentages of Ki67-positive human cardiomyocytes. e Immunofluorescence staining of Ki67-positive human cardiomyocytes treated with a five-protein combination including C1QB, NRP1, PLTP, FUCA1, and SERPING1 (5-P combo). Scale bar, 10 μm. n = 3 biological repeats per group. f Principal component analysis of RNA sequencing data from human cardiomyocytes treated with FM and hiPM-cm. n = 3 biological repeats per group. g Volcano plot illustrating DEGs between human cardiomyocytes treated with FM and hiPM-cm. h Representative KEGG terms of cell proliferation-related genes upregulated in cardiomyocytes incubated with hiPM-cm versus FM. i Immunoblotting analysis showing the phosphorylated and total protein levels of AKT, ERK, and STAT3 in human cardiomyocytes treated with FM and hiPM-cm. GAPDH was used as a loading control. n = 3 biological repeats per group for phosphorylated and total ERK; n = 6 biological repeats per group for the other proteins. j Quantification of Ki67-positive human cardiomyocytes treated with hiPM-cm and inhibitors for PI3K-AKT (A-674563), ERK (PD0325901), and JAK-STAT (Stattic) pathways in single or in combination. n = 3 biological repeats per group. Quantitative data are presented as the mean ± SEM. Groups were compared using a two-tailed unpaired Student’s t test (i) or one-way ANOVA followed by post hoc Tukey test (a, e, and j). Source data are provided as a Source Data file.
Fig. 5
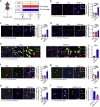
Fig. 5. HiPM-cm promotes cardiomyocyte proliferation in adult mouse hearts.
a Schematic diagram depicting the experiment to evaluate the pro-proliferative potential of hiPM-cm on cardiomyocytes in adult mouse hearts intramyocardially injected with PBS (PBS group), FM (FM group), and hiPM-cm (hiPM-cm group). Cartoon elements used in the schematic diagram were created using BioRender. bd Representative immunofluorescence images and quantification of the percentages of cardiomyocytes positive for Ki67 (b), pHH3 (c), and Aurora B (d) one week after the injection. Ki67/pHH3/Aurora B (green), PCM1 (red), and Hoechst (blue). Scale bar, 20 μm. n = 5 mice per group. e Representative immunofluorescence images and quantification of single-colored (red and green) cardiomyocytes using MADM mice one week after the injection. Scale bar, 50 μm. n = 9 mice per group. fh Representative immunofluorescence images and quantification of the percentages of cardiomyocytes positive for phosphorylated AKT (f), ERK (g), and STAT3 (h) three days after the injection. pAKT/pERK/pSTAT3 (green), PCM1 (red), and Hoechst (blue). Scale bar, 20 μm. n = 5 mice per group. i Representative immunofluorescence images and quantification of Ki67-positive human cardiomyocytes treated with hiPM-cm and three inhibitors in combination (hiPM-cm + 3i). Inhibitors used were AKT inhibitor A-674563, ERK inhibitor PD0325901, and STAT3 inhibitor Stattic. Scale bar, 20 μm. Ki67 (green), PCM1 (red), and Hoechst (blue). White arrows denote Ki67-positive cells and yellow arrows denote Ki67-negative cells. n = 5 mice per group. Quantitative data are presented as the mean ± SEM. Groups were compared using a two-tailed unpaired Student’s t test (e and i) or one-way ANOVA followed by post hoc Tukey test (bd and fh). Source data are provided as a Source Data file.
Fig. 6
Fig. 6. HiPM-cm enhances cardiac regeneration in mouse hearts after I/R.
a Schematic diagram depicting the experiment to evaluate the pro-proliferative potential of hiPM-cm on cardiomyocytes in adult mouse hearts that received sham surgery (Sham group), or I/R surgery followed by intramyocardial injection with FM (I/R + FM group) and hiPM-cm (I/R + hiPM-cm group) at five minutes before reperfusion. Cartoon elements used in the schematic diagram were created using BioRender. b Measurement of serum cTnT levels by ELISA at three days after the surgery. n = 8 mice per group. c Ratios of heart weight to tibial length (HW/TL) at one week after the surgery. n = 8 mice per group. d Representative images and quantification of Masson’s trichrome staining of heart sections from Sham, I/R + FM, and I/R + hiPM-cm groups at one week after the surgery. Scale bar, 50 μm. n = 5 mice per group. eg Representative immunofluorescence images and quantification of the percentages of cardiomyocytes positive for Ki67 (e), pHH3 (f), and Aurora B (g) one week after the surgery. Scale bar, 20 μm. n = 4 mice per group for Ki67 staining and Aurora B staining; n = 5 mice per group for pHH3 staining. Ki67/pHH3/Aurora B (green), PCM1 (red), and Hoechst (blue). h Representative images of wheat germ agglutinin (WGA) staining and quantification of cardiomyocyte cross-sectional areas one week after the surgery. Scale bar, 10 μm. n = 5 mice per group. Quantitative data are presented as the mean ± SEM. Groups were compared using one-way ANOVA followed by post hoc Tukey test (b-h). Source data are provided as a Source Data file.
Fig. 7
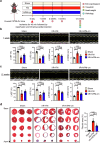
Fig. 7. HiPM-cm ameliorates cardiac dysfunction in mouse hearts after I/R.
a Schematic diagram depicting the experiment to evaluate cardiac function in adult mouse from the Sham group, I/R + FM group, and I/R + hiPM-cm group. Cartoon elements used in the schematic diagram were created using BioRender. b, c Representative echocardiographic images and quantitative data of left ventricular ejection fraction (LVEF), fractional shortening (LVFS), end-diastolic dimension (LVEDD), and end-systolic dimension (LVESD) at one week (b) and 12 weeks (c) after the surgery. n = 8 mice per group. d Representative images and quantification of Masson’s trichrome staining of heart sections from Sham, I/R + FM, and I/R + hiPM-cm groups at 12 weeks after the surgery. Scale bar, 2 mm. n = 8 mice per group. Quantitative data are presented as the mean ± SEM. Groups were compared using one-way ANOVA followed by post hoc Tukey test (bd). Source data are provided as a Source Data file.

References

    1. Braunwald, E. The war against heart failure: the Lancet lecture. Lancet385, 812–824 (2015). - PubMed
    1. Chen, Y. et al. Reversible reprogramming of cardiomyocytes to a fetal state drives heart regeneration in mice. Science373, 1537–1540 (2021). - PubMed
    1. Xia, B. et al. The alternative splicing landscape of infarcted mouse heart identifies isoform level therapeutic targets. Sci. Data11, 1154 (2024). - PMC - PubMed
    1. Humphries, S., Mars, K., Hofmann, R., Held, C. & Olsson, E. M. G. Randomized evaluation of routine beta-blocker therapy after myocardial infarction quality of life (RQoL): design and rationale of a multicentre, prospective, randomized, open, blinded endpoint study. Eur. Heart J. Open3, oead036 (2023). - PMC - PubMed
    1. Steg, P. G. Routine beta-blockers in secondary prevention - on injured reserve. N. Engl. J. Med.390, 1434–1436 (2024). - PubMed

Substances

LinkOut - more resources