. 2025 Oct;32(10):1915-1929.
doi: 10.1038/s41418-025-01488-6. Epub 2025 Mar 28.

The transcription factor LHX2 mediates and enhances oncogenic BMP signaling in medulloblastoma

Affiliations

The transcription factor LHX2 mediates and enhances oncogenic BMP signaling in medulloblastoma

Yae Ohata et al. Cell Death Differ. 2025 Oct.

Abstract

Oncogenic events perturb cerebellar development leading to medulloblastoma, a common childhood brain malignancy. Molecular analyses classify medulloblastoma into the WNT, SHH, Group 3 and Group 4 subgroups. Bone morphogenetic protein (BMP) pathways control cerebellar development and have been linked to the progression of medulloblastoma disease, with major remaining gaps in their mechanistic and clinically-relevant roles. We therefore aimed at exploring BMP mechanisms of action in medulloblastoma. Patient-derived tumors from different subgroups were analyzed in mouse xenografts, complemented by independent tumor immunohistochemical analysis. Cell-based assays analyzed signaling mechanisms. Medulloblastoma cell orthotopic xenografts analyzed tumor growth and metastasis in vivo. Active BMP signaling, detected as nuclear and phosphorylated SMAD1/5, characterized several medulloblastoma subgroups, with enrichment in Group 4, SHH and Group 3 tumors. Spatial transcriptomics in tumor areas, complemented by transcriptomic analysis of multiple cell models, identified BMP-dependent transcriptional induction of the LIM-homeobox gene 2 (LHX2). BMP signaling via SMADs induced LHX2 expression and LHX2 transcriptionally induced BMP type I receptor (ACVR1) expression by association with the proximal promoter region of the ACVR1 gene. BMP signaling and LHX2 gain-of-function expression led to enriched stemness and associated chemoresistance in medulloblastoma cultures. In-mouse orthotopic transplantation of paired primary/recurrent Group 4 medulloblastoma cell populations, correspondingly expressing LHX2-low/BMP-low signaling and LHX2-high/BMP-high signaling, ascribed to the latter (high) group more efficient tumor propagation and spinal cord metastatic potential. Depletion of LHX2 in these recurrent tumor cells suppressed both BMP signaling and tumor propagation in vivo. Thus, LHX2 cooperates with, and enhances, oncogenic BMP signaling in medulloblastoma tumors. The molecular pathway that couples LHX2 function to BMP signaling in medulloblastoma deepens our understanding this malignancy.


Conflict of interest statement

Competing interests: The authors declare no competing interests. Ethics approval and consent to participate: All the procedures were performed in accordance with the guidelines for Ethical Conduct in the Care and Use of Animals as stated in The International Guiding Principles for Biomedical Research involving Animals, developed by the Council for International Organizations of Medical Sciences (CIOMS). For the animal experiments in Sweden, mouse husbandry and manipulations followed the national guidelines after approval by the Uppsala University Animal Experiment Ethics Board (C105/16, 5.8.18-16350/2017 and 5.8.18-18303/2021). For the animal experiments in Spain, mice were housed according to institutional guidelines and all experimental procedures were performed in compliance with the guidelines for the welfare of experimental animals as approved by the Universidad of Zaragoza Ethics Committee (CEICA PI34/21).

Figures
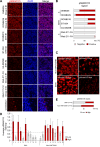
Fig. 1
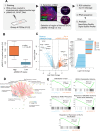
Fig. 1. pSMAD1/5 multispectral immunofluorescence in PDX MB tumors.
A Phosphorylated SMAD1/5 (pSMAD1/5) abundance, in seven medulloblastoma (MB) patient-derived xenografts (PDXs) in mice and in normal mouse cerebellum, was analyzed by multispectral immunofluorescence. Representative images are shown. Molecular subgroups are indicated under each PDX name. “#1” and “#2” indicate different PDX models. Scale bar: 10 μm. B Quantification of the pSMAD1/5 signals in the PDX MB sections, with representative images presented in A. Tumor cells were classified into two groups (negative or positive) based on the pSMAD1/5 staining intensities quantified in every cell in three selected areas per sample, representing a total of 4 000 to 10 000 cells, and plotted as percent of the total cell number. C Representative images of a human MB TMA highlighting SHH or non-WNT/SHH MB tumors immunostained for pSMAD1/5 as in panel (A). Scale bar: 10 μm. D Quantification of the pSMAD1/5 signals in each one of the 20 human MB TMA tumors, with representative images presented in C. Tumors were classified into two Groups (SHH or non-WNT/SHH) and pSMAD1/5 staining intensities are presented as low and high as in (B). The horizontal dotted line marks the median pSMAD1/5 intensity level. E Cumulative representation of the data in panel (D), quantified as in (B), except that pSMAD1/5 intensity is classified as low and high.
Fig. 2
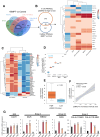
Fig. 2. Spatial transcriptomic analysis of pSMAD1/5-high and -low tumor cells in Group 4 MB PDXs.
A Schematic workflow of spatial RNA sequencing of MB PDXs performed by NanoString GeoMx® Digital Spatial Profiler. Eighteen ROIs from the two Group 4 PDX samples (presented in Fig. 1 as Group 4 #1 and #2) with high or low phosphorylated SMAD1/5 (pSMAD1/5) levels were selected and subjected to analysis. B Box plot displaying the two pSMAD1/5 groups classified based on the median staining intensity of pSMAD1/5 (n = 18 ROIs, corresponding to 4000 to 10,000 cells per ROI). Horizontal lines indicate the median generated by quantification of more than 2000 data points, whiskers indicate the SEM and the p-value for the difference is also listed (derived using the Wilcoxon rank sum test). C Volcano plot of DEGs in pSMAD1/5-high cells with thresholds of significance shown as dotted lines (left). The top 10 up-regulated and top 10 down-regulated genes are listed (right). The color code represents the adjusted p-value. D Network analysis visualizing the interactions between significantly dysregulated pathways in pSMAD1/5-high tumor cells (p-value < 0.005 and overlap coefficient ≥ 0.5). Each node represents one biological process, and the size of the node corresponds to the number of the constituting genes. The lines refer to the significantly connected processes. The color code indicates the normalized enrichment score (NES). E Enrichment plots showing significantly regulated DEG sets in pSMAD1/5-high ROIs. Gene set enrichment analysis was performed using the Reactome database.
Fig. 3
Fig. 3. Comparative analysis of spatial and cellular RNA-seq identifies LHX2.
A Four-way Venn diagram showing the numbers of DEGs in four MB cell lines (D425, MB002, CHLA-01-MED and CHLA-01R-MED) treated with BMP7 (100 ng/ml) for 3 days, relative to the respective untreated cells. The common 279 DEGs between the four cell lines are highlighted (white). B (Left) Venn diagram showing the number of DEGs shared between spatial RNA-seq analyzed in Fig. 2, and the 4 BMP7-treated cell lines shown in (A). The 28 common DEGs between the spatial and the cellular RNA-seq analysis are highlighted (bold). (Right) Heatmap visualizing expression levels of the common 28 DEGs in the 5 analyzed experimental conditions. The color-coded scale represents log2 fold change values of each transcript in the respective condition. C Heatmap visualizing expression levels of DEGs in CHLA-01R-MED cells treated with LDN193189 for 3 days relative to untreated cells. LHX2 and KIF26A (highlighted in red) are common genes that were also highlighted in B. The color-coded scale represents the scaled counts per million (CPM) values of each transcript. D Box plot of normalized LHX2 mRNA expression in the four cell lines analyzed by RNA-seq. Horizontal lines indicate the median, whiskers indicate the SEM and the p-value for the difference relative to control is listed ***p < 0.001 (derived using the Wilcoxon rank sum test). E Normalized LHX2 mRNA expression in pSMAD1/5-high and -low tumor cells analyzed by spatial RNA-seq. Horizontal lines indicate the median, whiskers indicate the SEM and the significance level was derived using the Wilcoxon rank sum test. F Correlation plot showing a positive correlation between pSMAD1/5 signal intensity (arbitrary units, AU) and LHX2 mRNA expression in 18 ROIs of the two Group 4 PDX tumors. The Spearman correlation value (R) and corresponding p-value are shown. G LHX2 mRNA expression in MB cell lines was measured by RT-qPCR 3 days after treatment with BMP7 (100 ng/ml), BMP4 (100 ng/ml) or TGFβ1 (5 ng/ml). The results were normalized to GAPDH levels. Data are presented as mean values ± SD of three biological replicates. *p < 0.05, **p < 0.01, ***p < 0.001 compared with control (two-tailed paired Student’s t test).
Fig. 4
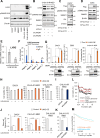
Fig. 4. LHX2 enhances BMP signaling.
Representative immunoblots of the indicated proteins in MB cell lines. Immunoblotting for Flag monitors transfected 3×Flag-LHX2 (C, D) and β-actin serves as loading control (AD). The six MB cell lines analyzed in (A) were cultured under stem cell conditions. LHX2 knockdown clones of CHLA-01R-MED (shLHX2#1 and shLHX2#2) were analyzed in (B). DAOY cells stably expressing 3×Flag-LHX2 and the control clone were analyzed in (C). D283 cells with transient overexpression of 3×Flag-LHX2 were collected and analyzed 24 h after transfection in (D). Molecular mass markers (kDa) are shown. For original images, see Supplementary Fig. S12. E LHX2 mRNA expression in DAOY cells stably expressing 3×Flag-LHX2 was measured by RT-qPCR 7 days after continuous culture with 0.2 µM LDN193189. The results were normalized to GAPDH levels. Data shown as the mean ± SD of three biological replicates. *p < 0.05, **p < 0.01 compared with control was assessed by two-tailed paired Student’s t test. F CUT&RUN assay in CHLA-01R-MED cells, treated with 100 ng/ml BMP7 or vehicle (-) for 3 days. Antibody against SMAD1 was used. qPCR data were normalized to the total amount of input chromatin and shown as fold-enrichment relative to IgG (negative control) for the BMP7-stimulated samples. Data shown as the mean ± SD were derived from three biological replicates. *p < 0.05, **p < 0.01, one-way ANOVA with Tukey test. Primer sequences are shown in Supplementary Table S5. G BRE2 luciferase reporter assays. DAOY, D283 or CHLA-01-MED cells with transient overexpression (OE, blue bars) of LHX2 or control (Cont) vector were stimulated with 100 ng/ml BMP7 or vehicle. Firefly luciferase was normalized to β-gal or renilla luciferase activity, as indicated. Mean values from 2 biological replicates, each with technical triplicates and corresponding SD are plotted. *p < 0.05, **p < 0.01, ***p < 0.001 compared to the indicated reference condition was assessed by one-way ANOVA with Tukey test. Below each diagram a corresponding immunoblot indicates the level of 3×Flag-LHX2 protein expression over β-actin loading control in the transfected cells and molecular mass markers (kDa) are shown. Proliferation assays in DAOY and CHLA-01-MED cells overexpressing (OE, blue bars) LHX2 or control vector (gray bars) (H) or in CHLA-01R-MED-shLXH2#1 cells (I). Cell proliferation was analyzed 72 h after treatment with 0.2 µM LDN193189 or DMSO (−) (H) or in the absence of any treatment (I) by PrestoBlue. Mean values from 3 biological replicates, each with technical triplicates and corresponding SD are plotted (H) or representative data shown as the mean ± SD of three technical replicates are plotted in (I). No significance was confirmed by one-way ANOVA with Tukey test. Average stem cell frequencies in DAOY and CHLA-01-MED cells overexpressing (OE, blue bars) LHX2 or control vector (gray bars) and in CHLA-01R-MED treated with 0.2 µM LDN193189 or DMSO (-) for 5 days (J) or in CHLA-01R-MED-shLHX2#1 compared to the control (K). Stem cell frequencies were calculated by ELDA and shown as bar graphs of mean values from 2 biological replicates, each with 8 technical replicates. Corresponding SD are not shown as the ELDA software generates only upper and lower limits of the measurements as shown in the original ELDA graphs of (J) and (K), in Supplementary Fig. S6C. *p < 0.05, **p < 0.01, ***p < 0.001 was assessed by chi-square test. L CHLA-01R-MED cells with or without LHX2 overexpression treated with the indicated concentration of vincristine, in combination or not with 0.2 µM LDN193189. Twenty-four hours after the treatment, cell viability was measured by PrestoBlue. Mean values from 3 biological replicates, each with technical triplicates and corresponding SD are plotted as percent viability relative to the control (100%). M Kaplan-Meier analysis demonstrating the association between LHX2 mRNA expression and ten-year overall survival of 612 MB patients, plotted from R2: Genomics Analysis and Visualization Platform (https://r2.amc.nl). Data set: Cavalli et al. [5]. Based on the average LHX2 mRNA expression, the 612 patients were divided into 2 groups (LHX2-high and -low). A p-value was calculated with a log-rank test.
Fig. 5
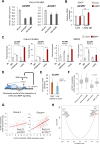
Fig. 5. LHX2 induces ACVR1 to form a feed-forward loop in BMP signaling.
A ACVR1 mRNA expression was analyzed in CHLA-01R-MED cells 48 h after transfection of siLHX2 (#1, #4, left panel), or from LHX2 stable knockdown clones (shLHX2#1, #2, right panel), by RT-qPCR. The results were normalized to GAPDH levels. Data shown as the mean ± SD are representative, each with three biological replicates. *p < 0.05, **p < 0.01 compared with control assessed by two-tailed paired Student’s t test. B ACVR1 mRNA expression analyzed by RT-qPCR in DAOY cells stably overexpressing (OE) LHX2. Cells were stimulated with vehicle (-) or 100 ng/ml BMP7 for 3 days. Data shown are representative, each with three technical replicates. *p < 0.05, **p < 0.01 by one-way ANOVA with Tukey test. C CUT&RUN assay in CHLA-01R-MED and MB002 cells, treated with 100 ng/ml BMP7 or vehicle (-) for 3 days. Antibodies against LHX2 and H3K4me3 were used. qPCR data were normalized to the total amount of input chromatin and shown as fold-enrichment relative to IgG (negative control). Data shown as the mean ± SD are representative, each with three technical replicates. *p < 0.05, **p < 0.01, one-way ANOVA with Tukey test. Primer sequences are shown in Supplementary Table S5. D Schematic model of the interaction of LHX2 with two regulatory sequences on the ACVR1 gene resulting in RNA polymerase II (light-colored oval) and cofactors (small ovals) mediating transcription and consequent enhanced BMP signaling. E ACVR1 mRNA expression in 18 regions of interest (ROIs) analyzed by NanoString GeoMx® profiling representing the two Group 4 PDXs, stratified as pSMAD1/5-high and -low tumor cells. FDR represents adjusted p-value. F, G mRNA expression in MB was plotted from R2: Genomics Analysis and Visualization Platform (https://r2.amc.nl). Data set: Cavalli et al. [5]. ACVR1 expression in each subgroup of MB is shown as a box plot with horizontal lines indicating the median, whiskers indicating the SEM and numbers (n) of samples indicated (F). Correlation plots show a positive correlation between ACVR1 and LHX2 mRNA expression in Group 3 (left) and Group 4 (right) MB (G). Spearman correlation values (R) and associated p-values derived by the Wilcoxon rank sum test are shown. H Correlation analysis of LHX2 mRNA expression relative to the expression of all protein-coding genes across 1641 MB sample plotted from R2: Genomics Analysis and Visualization Platform (https://r2.amc.nl). Data set: Weishaupt et al. [46]. Gene expression in log10 FDR is plotted against the correlation (r) value showing only significantly regulated genes. Individual gene names are indicated, with those being the most highly correlated and higher expressed shown in red and those anti-correlated in blue.
Fig. 6
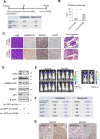
Fig. 6. LHX2 positively contributes to MB tumor propagation.
A Experimental timeline of the in vivo study (top). CHLA-01-MED or CHLA-01R-MED cells were orthotopically transplanted into the cerebellum of mice (n = 7 per cell line). The mice were sacrificed when body weight loss was higher than 10% of the original weight. The dates on which the mice were sacrificed are shown. The table shows the number of primary tumors and spinal metastases confirmed by histological assessment (bottom). B Primary tumor size was measured on hematoxylin and eosin (H&E) stained slides by QuPath. The bar graph shows mean values and SD derived from the four or seven independent data points. C H&E staining and immunohistochemistry for pSMAD1/5, SMAD1, and LHX2 of the orthotopic xenograft of CHLA-01-MED and CHLA-01R-MED cells. Primary tumors in the cerebellum (left, scale bar 20 µm) and spinal metastases (right, scale bar 200 µm). D Representative immunoblots of CHLA-01R-MED luc-GFP-shLHX2#1, #2, and Luc-GFP-shControl cells analyzed prior to orthotopic transplantation. LHX2, GFP (internal control expressed by the lentiviral shRNA vectors), C-terminally phosphorylated SMAD1/5/8, SMAD1, ID1, and β-actin (loading control) are shown along with molecular mass markers (kDa). For original images, see Supplementary Fig. S12. E In vivo bioluminescence imaging of orthotopic xenografts (in 8 mice in total) generated by 2 × 104 CHLA-01R-MED cells carrying control (shCont) or LHX2-specific (shLHX2) shRNAs, and imaged at 2.5 weeks post-transplantation (left). The images on the right show single mice in which 2 × 105 cells were orthotopically transplanted in order to visualize both primary tumors and spinal metastases. The luminescence scale is shown in photons (p) per sec per cm2 per steradian (sr). F Table listing the number of primary tumors and spinal metastases confirmed by bioluminescence imaging for the three different cell populations transplanted per cerebellum. G Immunohistochemistry for pSMAD1/5 and ID3 of representative primary tumors after orthotopic xenografts of CHLA-01R-MED cells carrying shCont or LHX2-shRNA (scale bar 50 µm).

References

    1. Hatten ME, Roussel MF. Development and cancer of the cerebellum. Trends Neurosci. 2011;34:134–42. - PMC - PubMed
    1. Northcott PA, Robinson GW, Kratz CP, Mabbott DJ, Pomeroy SL, Clifford SC, et al. Medulloblastoma. Nat Rev Dis Prim. 2019;5:11. - PubMed
    1. Swartling FJ, Hede SM, Weiss WA. What underlies the diversity of brain tumors? Cancer Metastasis Rev. 2013;32:5–24. - PMC - PubMed
    1. Wang J, Garancher A, Ramaswamy V, Wechsler-Reya RJ. Medulloblastoma: from molecular subgroups to molecular targeted therapies. Annu Rev Neurosci. 2018;41:207–32. - PubMed
    1. Cavalli FMG, Remke M, Rampasek L, Peacock J, Shih DJH, Luu B, et al. Intertumoral heterogeneity within medulloblastoma subgroups. Cancer Cell. 2017;31:737–54.e6. - PMC - PubMed

MeSH terms

LinkOut - more resources