. 2025 Mar 27;5(1):92.
doi: 10.1038/s43856-025-00799-6.

Long-term immune responses to SARS-CoV-2 Omicron BA.4/5 mRNA booster in people living with HIV

Affiliations

Long-term immune responses to SARS-CoV-2 Omicron BA.4/5 mRNA booster in people living with HIV

Matteo Augello et al. Commun Med (Lond). .

Abstract

Background: Variant-adapted vaccines are recommended in vulnerable populations to address the waning immunity and the emergence of immune-escaping SARS-CoV-2 variants, yet data about immune responses to such vaccines in people living with HIV (PLWH) are limited. We therefore aimed to assess long-term immune responses to an original-BA.4/5 mRNA booster in this population.

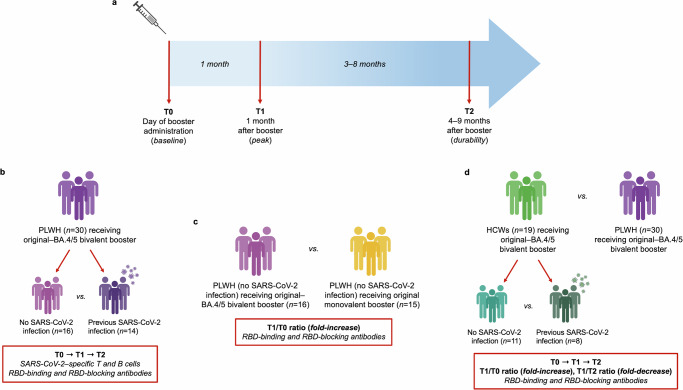
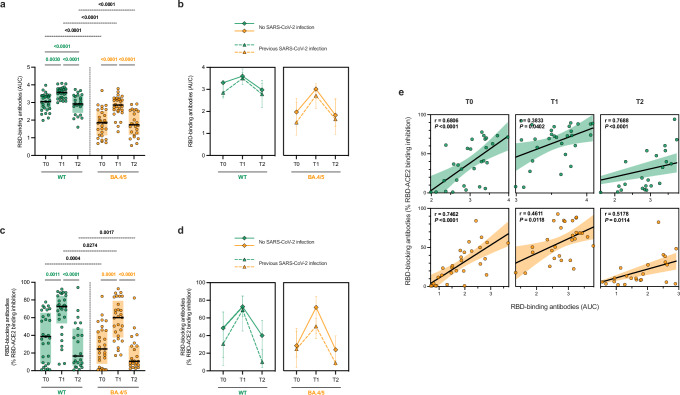
Methods: In this prospective longitudinal study, PLWH receiving either an original-BA.4/5 bivalent booster or an original monovalent booster and HIV-negative healthcare workers (HCWs) receiving a bivalent booster were enrolled and sampled before (T0), 1 month (T1), and 4-9 months (T2) after the vaccine administration. SARS-CoV-2-specific T and B cells, RBD-binding antibodies, and RBD-blocking antibodies against both wild type (WT) and omicron BA.4/5 virus were determined.

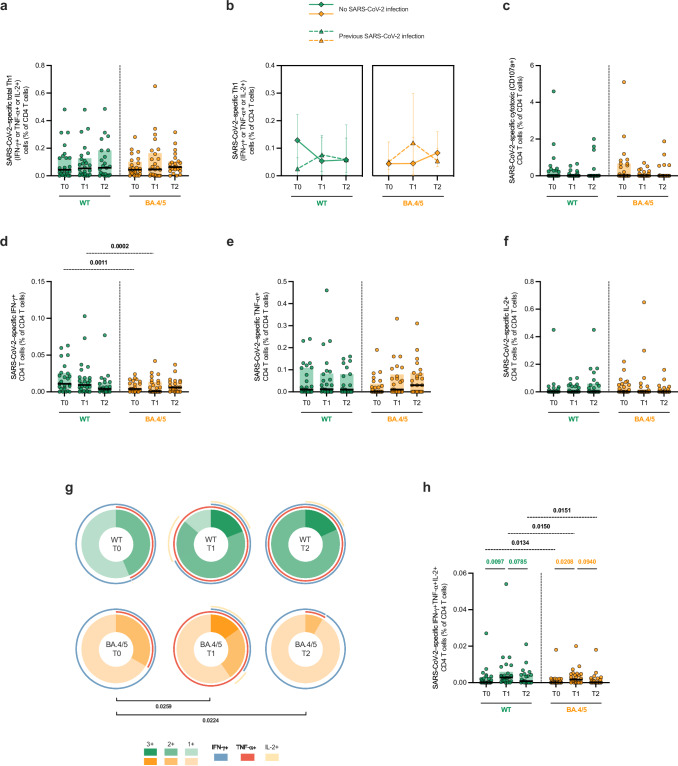
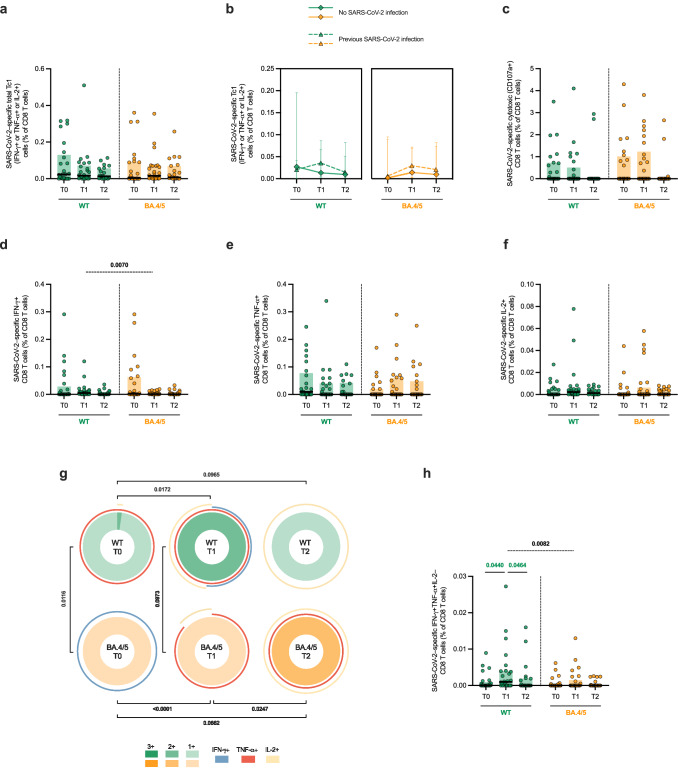
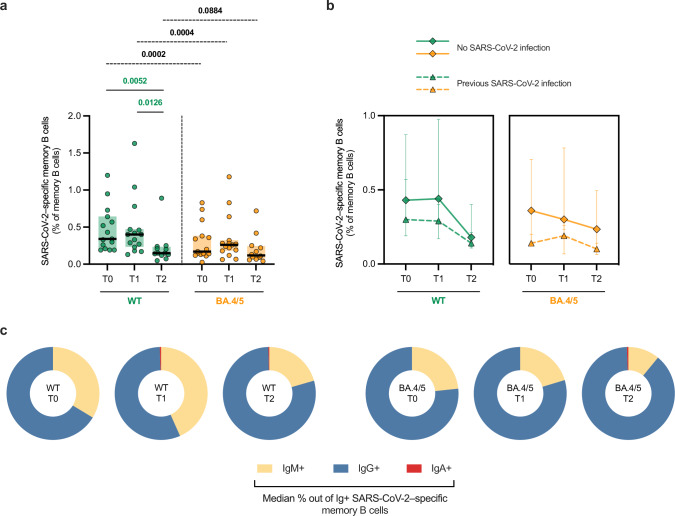
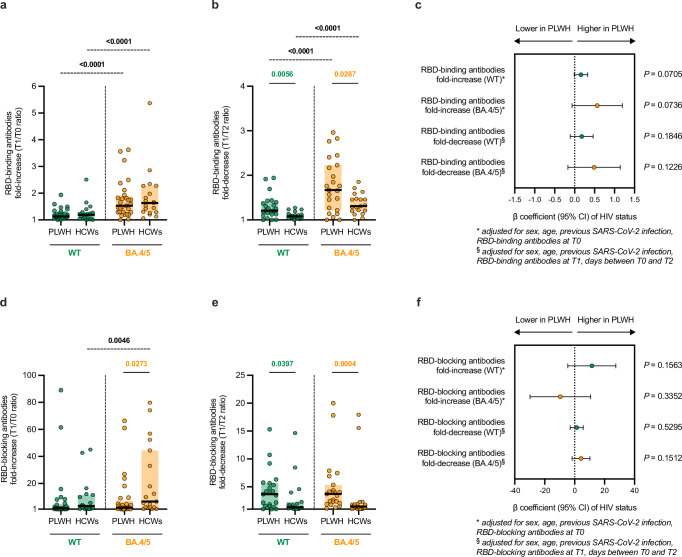
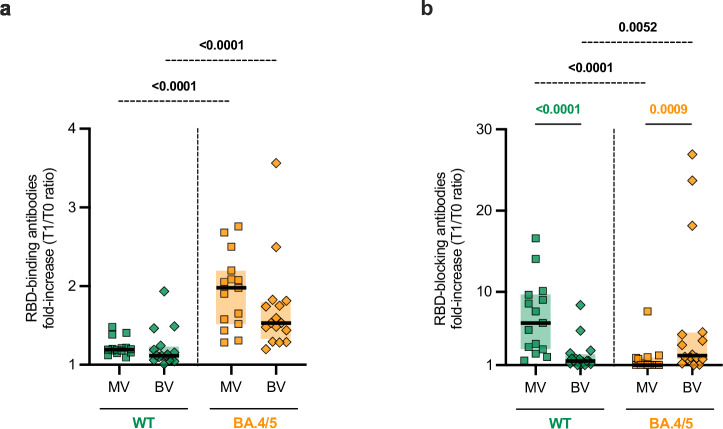
Results: The bivalent booster is able to transiently increase both humoral and polyfunctional T cell responses in PLWH, with humoral responses comparable to those observed in HCWs. While T cell responses are cross-reactive against viral variants and stable over time, humoral immunity is imprinted to the ancestral virus and wanes quickly. Furthermore, whilst previous SARS-CoV-2 infection does not affect the trajectory of vaccine-elicited immune responses, markers of HIV-related T cell dysfunction are associated with lower antibody peak responses and higher antibody waning. Lastly, the bivalent booster was superior to the monovalent one in inducing BA.4/5-reactive RBD-blocking antibodies.

Conclusions: The original-BA.4/5 bivalent booster is highly immunogenic in PLWH and superior to the monovalent one in inducing humoral responses against the BA.4/5 virus, although HIV-related T cell dysfunction markers are associated with blunted and less durable antibody immunity.

Plain language summary

SARS-CoV-2 vaccines adapted to recently circulating variants are recommended in vulnerable populations, such as people living with HIV (PLWH). In this study, we studied immune responses to a newly designed mRNA vaccine in this cohort. We showed that the vaccine could stimulate antibodies, small proteins that the body produces against the SAR-CoV-2 original and the mutant BA.4/5 variants to fight the virus. This new design produced improved antibody responses against SARS-CoV-2 mutant variants compared with older designs, but PLWH with a compromised immune system have a short-lived protection against the evolving virus.


Conflict of interest statement

Competing interests: The authors declare no competing interests.

Figures

Fig. 1
Fig. 1. Study design.
Schematic representation of the study design showing the time-points at which study participants were sampled (a), as well as the number of participants who were enrolled and the immune parameters that were measured at each specified time-point to explore: b peak and durability of immune responses to the original–BA.4/5 bivalent booster in PLWH either with or without previous SARS-CoV-2 infection; c the possible role of the ancestral spike in the bivalent vaccine in exacerbating immunologic imprinting thus affecting the bivalent booster immunogenicity in PLWH; d possible differences in bivalent booster immunogenicity and durability between PLWH and HIV-negative HCWs. Created in BioRender [Augello, M. (2025), https://BioRender.com/t94l162].
Fig. 2
Fig. 2. SARS-CoV-2–specific CD4 T cells in PLWH receiving the original–BA.4/5 bivalent booster.
Frequency (percentage, %) of total SARS-CoV-2–specific Th1 (IFN-γ+ or TNF-α+ or IL-2+) cells reactive against WT and BA.4/5 virus within CD4 T cells in the entire cohort (a) and in PLWH stratified according to previous SARS-CoV-2 infection (b). c Frequency (percentage, %) of SARS-CoV-2–specific cytotoxic (CD107a+) CD4 T cells reactive against WT and BA.4/5 virus within CD4 T cells. Frequency (percentage, %) of SARS-CoV-2–specific CD4 T cells producing IFN-γ+ (d), TNF-α+ (e), or IL-2+ (f) reactive against WT and BA.4/5 virus within CD4 T cells. g Donut charts showing the median distribution of polyfunctionality profiles within SARS-CoV-2–specific Th1 cells; the donut slices represent median percentages of tri- (3+), bi- (2+), and mono- (1+) functional Th1 cells reactive against WT and BA.4/5 virus; the arches around the circumference indicate the particular cytokine (IFN-γ, TNF-α, IL-2) produced by the portion of T cells that lie under the arc; parts of the donut surrounded by multiple arches represent polyfunctional cells. h Frequency (percentage, %) of trifunctional (IFN-γ+TNF-α+IL-2+) SARS-CoV-2–specific Th1 cells reactive against WT and BA.4/5 virus within CD4 T cells. Green/orange circles (scatter plots): individual values; black bars (scatter plots): median values; green/orange boxes (scatter plots): interquartile ranges; green/orange diamonds and triangles (trajectory plots): median values; green/orange error bars (trajectory plots): interquartile ranges; statistical analyses in scatter plots: Kruskall–Wallis test with Dunn’s multiple comparisons test (comparison between time-points; P values < 0.1 showed in green or orange above solid lines) and Wilcoxon test (comparison between WT- and BA.4/5-reactive T cells; P values < 0.1 showed in black above dashed lines); statistical analyses in trajectory plots: Mann–Whitney test (comparison between PLWH with no SARS-CoV-2 infection and PLWH with previous SARS-CoV-2 infection); statistical analyses between donut charts: permutation test; T0 (day of booster administration): n = 25; T1 (1 month after booster administration): n = 26; T2 (4–9 months after booster administration): n = 23. SARS-CoV-2–specific T cells were measured subtracting unspecific cytokine production in paired unstimulated control samples from stimulated samples.
Fig. 3
Fig. 3. SARS-CoV-2–specific CD8 T cells in PLWH receiving the original–BA.4/5 bivalent booster.
Frequency (percentage, %) of total SARS-CoV-2–specific Tc1 (IFN-γ+ or TNF-α+ or IL-2+) cells reactive against WT and BA.4/5 virus within CD8 T cells in the entire cohort (a) and in PLWH stratified according to previous SARS-CoV-2 infection (b). c Frequency (percentage, %) of SARS-CoV-2–specific cytotoxic (CD107a+) CD8 T cells reactive against WT and BA.4/5 virus within CD8 T cells. Frequency (percentage, %) of SARS-CoV-2–specific CD8 T cells producing IFN-γ+ (d), TNF-α+ (e), or IL-2+ (f) reactive against WT and BA.4/5 virus within CD8 T cells. g Donut charts showing the median distribution of polyfunctionality profiles within SARS-CoV-2–specific Tc1 cells; the donut slices represent median percentages of tri- (3+), bi- (2+), and mono- (1+) functional Tc1 cells reactive against WT and BA.4/5 virus; the arches around the circumference indicate the particular cytokine (IFN-γ, TNF-α, IL-2) produced by the portion of T cells that lie under the arc; parts of the donut surrounded by multiple arches represent polyfunctional cells. h Frequency (percentage, %) of bifunctional (IFN-γ+TNF-α+IL-2–) SARS-CoV-2–specific Tc1 cells reactive against WT and BA.4/5 virus within CD8 T cells. Green/orange circles (scatter plots): individual values; black bars (scatter plots): median values; green/orange boxes (scatter plots): interquartile ranges; green/orange diamonds and triangles (trajectory plots): median values; green/orange error bars (trajectory plots): interquartile ranges; statistical analyses in scatter plots: Kruskall–Wallis test with Dunn’s multiple comparisons test (comparison between time-points; P values < 0.05 showed in green or orange above solid lines) and Wilcoxon test (comparison between WT- and BA.4/5-reactive T cells; P values < 0.05 showed in black above dashed lines); statistical analyses in trajectory plots: Mann–Whitney test (comparison between PLWH with no SARS-CoV-2 infection and PLWH with previous SARS-CoV-2 infection); statistical analyses between donut charts: permutation test; T0 (day of booster administration): n = 25; T1 (1 month after booster administration): n = 26; T2 (4–9 months after booster administration): n = 23. SARS-CoV-2–specific T cells were measured subtracting unspecific cytokine production in paired unstimulated control samples from stimulated samples.
Fig. 4
Fig. 4. SARS-CoV-2–specific memory B cells in PLWH receiving the original–BA.4/5 bivalent booster.
Frequency (percentage, %) of SARS-CoV-2–specific memory B cells reactive against WT and BA.4/5 virus within memory B cells in the entire cohort (a) and in PLWH stratified according to previous SARS-CoV-2 infection (b). c Donut charts showing the median distribution of IgM+, IgG+, and IgA+ cells within SARS-CoV-2–specific memory B cells. Green/orange circles (scatter plots): individual values; black bars (scatter plots): median values; green/orange boxes (scatter plots): interquartile ranges; green/orange diamonds and triangles (trajectory plots): median values; green/orange error bars (trajectory plots): interquartile ranges; statistical analyses in scatter plots: Kruskall–Wallis test with Dunn’s multiple comparisons test (comparison between time-points; P values < 0.05 showed in green or orange above solid lines) and Wilcoxon test (comparison between WT- and BA.4/5-reactive T cells; P values < 0.05 showed in black above dashed lines); statistical analyses in trajectory plots: Mann–Whitney test (comparison between PLWH with no SARS-CoV-2 infection and PLWH with previous SARS-CoV-2 infection); T0 (day of booster administration): n = 15; T1 (1 month after booster administration): n = 15; T2 (4–9 months after booster administration): n = 12.
Fig. 5
Fig. 5. SARS-CoV-2–specific humoral responses in PLWH receiving the original–BA.4/5 bivalent booster.
RBD-binding antibodies – expressed as area under the curve (AUC) – against WT and BA.4/5 virus in the entire cohort of PLWH (a) and in PLWH stratified according to previous SARS-CoV-2 infection (b). RBD-blocking antibodies – expressed as percentage (%) of inhibition of RBD-ACE2 binding – against WT and BA.4/5 virus in the entire cohort of PLWH (c) and in PLWH stratified according to previous SARS-CoV-2 infection (d). Green/orange circles (scatter plots): individual values; black bars (scatter plots): median values; green/orange boxes (scatter plots): interquartile ranges; green/orange diamonds and triangles (trajectory plots): median values; green/orange error bars (trajectory plots): interquartile ranges; statistical analyses in scatter plots: Kruskall–Wallis test with Dunn’s multiple comparisons test (comparison between time-points; P values < 0.05 showed in green or orange above solid lines) and Wilcoxon test (comparison between WT- and BA.4/5-reactive T cells; P values < 0.05 showed in black above dashed lines); statistical analyses in trajectory plots: Mann–Whitney test (comparison between PLWH with no SARS-CoV-2 infection and PLWH with previous SARS-CoV-2 infection); T0 (day of booster administration): n = 29; T1 (1 month after booster administration): n = 29; T2 (4–9 months after booster administration): n = 24. e Correlation between RBD-binding and RBD-blocking antibodies. Green/orange circles: individual values; solid black line: simple linear regression line; green/orange shadows: 95% confidence bands; statistical analysis: Spearman’s correlation test (r and P value reported above the plot).
Fig. 6
Fig. 6. SARS-CoV-2–specific humoral responses in HCWs receiving the original–BA.4/5 bivalent booster.
RBD-binding antibodies – expressed as area under the curve (AUC) – against WT and BA.4/5 virus in the entire cohort of HCWs (a) and in HCWs stratified according to previous SARS-CoV-2 infection (b). RBD-blocking antibodies – expressed as percentage (%) of inhibition of RBD-ACE2 binding – against WT and BA.4/5 virus in the entire cohort of HCWs (c) and in HCWs stratified according to previous SARS-CoV-2 infection (d). Green/orange hexagons (scatter plots): individual values; black bars (scatter plots): median values; green/orange boxes (scatter plots): interquartile ranges; green/orange diamonds and triangles (trajectory plots): median values; green/orange error bars (trajectory plots): interquartile ranges; statistical analyses in scatter plots: Friedman test with Dunn’s multiple comparisons test (comparison between time-points; P values < 0.05 showed in green or orange above solid lines) and Wilcoxon test (comparison between WT- and BA.4/5-reactive T cells; P values < 0.05 showed in black above dashed lines); statistical analyses in trajectory plots: Mann–Whitney test (comparison between HCWs with no SARS-CoV-2 infection and HCWs with previous SARS-CoV-2 infection); T0 (day of booster administration): n = 19; T1 (1 month after booster administration): n = 19; T2 (4–9 months after booster administration): n = 19. e Correlation between RBD-binding and RBD-blocking antibodies. Green/orange hexagons: individual values; solid black line: simple linear regression line; green/orange shadows: 95% confidence bands; statistical analysis: Spearman’s correlation test (r and P value reported above the plot).
Fig. 7
Fig. 7. Comparison of SARS-CoV-2–specific humoral responses in PLWH and HCWs receiving the original–BA.4/5 bivalent booster.
Fold-increase (T1/T0 ratio) and fold-decrease (T1/T2 ratio) of total RBD-binding (a, b) and RBD-blocking antibodies (d, e) against WT and BA.4/5 virus in PLWH (nT1/T0 = 29, nT1/T2 = 23) and HCWs (n = 19) receiving the bivalent booster. Values equals to 1 indicate no increase/decrease, while values higher than 1 indicate an increase/decrease. Green/orange circles and hexagons: individual values; black bars: median values; green/orange boxes: interquartile ranges; statistical analyses: Mann–Whitney test (comparison between PLWH and HCWs; P values < 0.05 showed in green or orange above solid lines) and Wilcoxon test (comparison between WT- and BA.4/5-reactive antibodies; P values < 0.05 showed in black above dashed lines). c, f Multivariable linear regression analysis exploring the association between HIV status (independent variable) and RBD-binding/blocking antibodies fold-change (dependent variable) adjusted for potential confounders as specified below the forest plot. Green/orange circles: β coefficient; black error bars: 95% confidence interval (CI).
Fig. 8
Fig. 8. Comparison of SARS-CoV-2–specific humoral responses in PLWH receiving the monovalent or bivalent booster.
Fold-increase (T1/T0 ratio) of total RBD-binding (a) and RBD-blocking antibodies (b) against WT and BA.4/5 virus in PLWH (without previous SARS-CoV-2 infection) receiving monovalent (MV) original (n = 15) or bivalent (BV) original–BA.4/5 booster (n = 16). Values equals to 1 indicate no increase, while values higher than 1 indicate an increase. Green/orange squares and diamonds: individual values; black bars: median values; green/orange boxes: interquartile ranges; statistical analyses: Mann–Whitney test (comparison between PLWH receiving MV or BV booster; P values < 0.05 showed in green or orange above solid lines) and Wilcoxon test (comparison between WT- and BA.4/5-reactive antibodies; P values < 0.05 showed in black above dashed lines).

References

    1. Collier, A. Y. et al. Immunogenicity of BA.5 Bivalent mRNA Vaccine Boosters. N. Engl. J. Med.388, 565–567 (2023). - PMC - PubMed
    1. Wang, Q. et al. Antibody Response to Omicron BA.4-BA.5 Bivalent Booster. N. Engl. J. Med.388, 567–569 (2023). - PMC - PubMed
    1. Wang, Q. et al. SARS-CoV-2 neutralising antibodies after bivalent versus monovalent booster. Lancet Infect. Dis.23, 527–528 (2023). - PMC - PubMed
    1. Hoffmann, M. et al. Effect of hybrid immunity and bivalent booster vaccination on omicron sublineage neutralisation. Lancet Infect. Dis.23, 25–28 (2023). - PMC - PubMed
    1. Wang, Q. et al. Deep immunological imprinting due to the ancestral spike in the current bivalent COVID-19 vaccine. Cell Rep. Med.4, 101258 (2023). - PMC - PubMed