. 2025 Mar 27;15(1):10584.
doi: 10.1038/s41598-025-94859-5.

Pathogen-specific stomatal responses in cacao leaves to Phytophthora megakarya and Rhizoctonia solani

Affiliations

Pathogen-specific stomatal responses in cacao leaves to Phytophthora megakarya and Rhizoctonia solani

Insuck Baek et al. Sci Rep. .

Abstract

Cacao is a globally significant crop, but its production is severely threatened by diseases, particularly Black Pod Rot (BPR) caused by Phytophthora spp. Understanding plant-pathogen interactions, especially stomatal responses, is crucial for disease management. Machine learning offers a powerful, yet largely untapped, approach to analyze and interpret complex plant responses in plant biology and pathology, particularly in the context of plant-pathogen interactions. This study explores the use of machine learning to analyze and interpret complex stomatal responses in cacao leaves during pathogen interactions. We investigated the impact of the black pod rot pathogen (Phytophthora megakarya) and a non-pathogenic fungus (Rhizoctonia solani) on stomatal aperture in two cacao genotypes (SCA6 and Pound7) under varying light conditions. Image analysis revealed diverse stomatal responses, including no change, opening, and closure, that were influenced by the interplay of genotype, pathogen isolate, and light conditions. Notably, SCA6 exhibited stomatal opening in response to P. megakarya specifically under a 12-hour light/dark cycle, suggesting a light-dependent activation of pathogen virulence factors. In contrast, Pound7 displayed stomatal closure in response to both P. megakarya and R. solani, indicating the potential recognition of conserved Pathogen-Associated Molecular Patterns (PAMPs) and a broader defense response. To further analyze these interactions, we employed machine learning techniques to predict stomatal area size. Our analysis identified key morphological features, with size-related traits being the strongest predictors. Shape-related traits also played a significant role when size-related traits were excluded from the prediction. This study demonstrates the power of combining image analysis and machine learning for discerning subtle, multivariate traits in stomatal dynamics during plant-pathogen interactions, paving the way for future applications in high-throughput disease phenotyping and the development of resistant crop varieties.

Keywords: Black pod rot; Cacao; Light conditions; Machine learning; Stomatal response.


Conflict of interest statement

Declarations. Competing interests: The authors declare no competing interests.

Figures

Fig. 1
Fig. 1
Research workflow and methodology. (a) Pathogen and mock inoculum (control) preparation. (b) Inoculation of excised cacao leaves (two genotypes). (c) Application of light (L) and dark (D) Conditions. (d, e) Time-series stomatal image acquisition (0, 24, 48 hpi). (f) Stomatal morphology image analysis. (g) Statistical and bioinformatics data analysis. (h) Machine learning for interaction analysis.
Fig. 2
Fig. 2
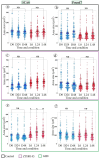
Stomatal aperture dynamics in cacao genotypes under different inoculation and light conditions. Stomatal aperture dynamics in SCA6 (a, c, e) and Pound7 (b, d, f) cacao genotypes under different inoculation and light conditions. Scatterplots illustrate stomatal aperture size (µm²) under D (blue) and L (12-hour light/12-hour dark, red) conditions over time (0, 24, and 48 h). (a, b): Control. (c, d): P. megakarya ZTH0145 inoculation. (e, f): P. megakarya GH8 inoculation. Solid horizontal lines represent mean values, with boxes indicating confidence intervals. No significant differences in stomatal aperture were observed for control and P. megakarya ZTH0145 inoculation across genotypes, light conditions, or time points (ANOVA, p > 0.05). Stomatal aperture significantly increased in SCA6 under the L following GH8 inoculation (Tukey’s HSD, p < 0.03), while remaining stable in SCA6 under D conditions and in Pound7 under both conditions. Different alphabetical letters indicate statistically significant differences between group means, as determined by Tukey’s HSD test. ND indicates no significant difference between groups connected by brackets, as determined by Tukey’s HSD test (p > 0.05).
Fig. 3
Fig. 3
Differential stomatal responses to P. megakarya isolate GH21 in cacao genotypes. Scatterplots depict stomatal aperture size (µm²) in SCA6 (a) and Pound7 (b) genotypes under D (blue) and L (red) conditions at 0, 24, and 48 h post-inoculation. Mean values are represented by horizontal lines, with confidence intervals indicated by boxes. A significant increase in stomatal aperture was observed in SCA6 under L condition at 48 h post-inoculation with GH21 (Tukey’s HSD, p < 0.0001). In contrast, stomatal aperture decreased in Pound7 under both L and D conditions (p < 0.05). Different alphabetical letters indicate statistically significant differences between group means (Tukey’s HSD). ND indicates no significant difference between groups connected by brackets, as determined by Tukey’s HSD test (p > 0.05).
Fig. 4
Fig. 4
Contrasting stomatal responses to R. solani. Isolate GC33-C in Cacao Genotypes. Scatterplots illustrate stomatal aperture size (µm²) in SCA6 (a) and Pound7 (b) genotypes under D (blue) and L (red) conditions at 0, 24, and 48 h post-inoculation. Mean values are represented by horizontal lines, with confidence intervals indicated by boxes. While stomatal aperture remained stable in SCA6, a significant decrease was observed in Pound7 under both L and D conditions at 48 h post-inoculation. Different alphabetical letters indicate statistically significant differences (Tukey’s HSD). ND indicates no significant difference between groups connected by brackets, as determined by Tukey’s HSD test (p > 0.05).
Fig. 5
Fig. 5
Changes in stomatal circularity under dark conditions in cacao genotypes following pathogen inoculation. (a) In the SCA6 genotype inoculated with GH8, a significant increase in circularity was observed at 24 h under D conditions. (b) In Pound7 inoculated with GH8, there was a statistically significant decrease in circularity at 24 h under D conditions. (c) When SCA6 was inoculated with GH21, circularity was significantly lower at 24 h under D compared to 48 h under D. (d) In Pound7 inoculated with GH21, circularity decreased at 24 h under D compared to 0 h. (e) Pound7 inoculated with R. solani. showed significantly lower circularity at 24 h under D than other time points. Different letters above data points indicate statistically significant differences between time points (Tukey’s HSD test). ND indicates no significant difference between groups connected by brackets, as determined by Tukey’s HSD test (p > 0.05).
Fig. 6
Fig. 6
Relationships among stomatal traits. (a) Pearson correlation coefficients between pairs of stomatal traits. Red indicates positive correlations, blue indicates negative correlations, and color intensity reflects the strength of the correlation. * indicates insignificance with a p-value of 0.0632. (b) PCA biplot showing the relationships between stomatal traits and the first two principal components (PC1 and PC2). The direction and length of the vectors indicate how each trait contributes to the principal components. (c) Contribution of individual stomatal traits to the first three principal components. (d) Hierarchical clustering analysis of stomatal traits using Ward’s linkage method.
Fig. 7
Fig. 7
Scatter plots comparing actual versus predicted stomatal area size values. (a) Model performance on the test set when all stomatal traits, genotype, pathogen isolate, and light condition are included as predictors. The close alignment of points to the diagonal indicates high predictive accuracy (R-square for training set = 0.999, validation set = 0.998). (b) Model performance on the test set when the three traits directly associated with stomatal area (perimeter, length, and width) are excluded as predictors. There is an increase in variability compared to (a) (R-square for training set = 0.672, validation set = 0.302). The diagonal line represents perfect prediction.
Fig. 8
Fig. 8
Receiver operating characteristic (ROC) curves and area under the curve (AUC) values for eight machine learning models in classifying pathogen treatments. The ROC curves illustrate the trade-off between true positive rate (sensitivity) and false positive rate (1-specificity) for each model. Higher AUC values indicate better classification performance. The models were trained on 80% of the data and validated on the remaining 20%, using 10-fold cross-validation.
Fig. 9
Fig. 9
Hypothetical model of stomatal responses in cacao to different pathogens and light conditions. (a) No Response to Control and ZTH0145: Mock inoculation and inoculation with P. megakarya isolate ZTH0145 did not induce stomatal aperture changes in either SCA6 or Pound7 cacao genotypes under both light conditions. (b) Light-Dependent Stomatal Opening in SCA6: P. megakarya isolates GH8 and GH21 triggered stomatal opening in SCA6 only under the 12 h light/12 h dark cycle (L), suggesting a potential role of light in promoting the action of effectors or phytotoxins that induce stomatal opening. (c) PAMP-Triggered Stomatal Closure in Pound7: P. megakarya isolate GH21 and the non-pathogenic fungus R. solani induced stomatal closure in Pound7 under both light conditions, likely through the activation of PAMP-triggered immunity. The response to R. solani suggests a broad recognition mechanism in Pound7.

References

    1. Vega, C. & Kwik-Uribe, C. Theobroma cacao: An introduction to the plant, its composition, uses, and health benefits. In Cocoa Butter and Related Compounds 35–62 (Elsevier, 2012).
    1. Wickramasuriya, A. M. & Dunwell, J. M. Cacao biotechnology: current status and future prospects. Plant. Biotechnol. J.16, 4–17 (2018). - PMC - PubMed
    1. Fister, A. S. et al. Two theobroma Cacao genotypes with contrasting pathogen tolerance show aberrant transcriptional and ROS responses after Salicylic acid treatment. J. Exp. Bot.66, 6245–6258 (2015). - PMC - PubMed
    1. Nieves-Orduña, H. E., Krutovsky, K. V. & Gailing, O. Geographic distribution, conservation, and genomic resources of Cacao theobroma Cacao L. Crop Sci.63, 1750–1778 (2023).
    1. Hou, S., Rodrigues, O., Liu, Z., Shan, L. & He, P. Small holes, big impact: Stomata in plant-pathogen-climate epic trifecta. Mol. Plant. (2024). - PMC - PubMed

Supplementary concepts

LinkOut - more resources