. 2025 May;26(9):2347-2377.
doi: 10.1038/s44319-025-00425-5. Epub 2025 Mar 27.

Praja2 controls P-body assembly and translation in glioblastoma by non-proteolytic ubiquitylation of DDX6

Affiliations

Praja2 controls P-body assembly and translation in glioblastoma by non-proteolytic ubiquitylation of DDX6

Emanuela Senatore et al. EMBO Rep. 2025 May.

Abstract

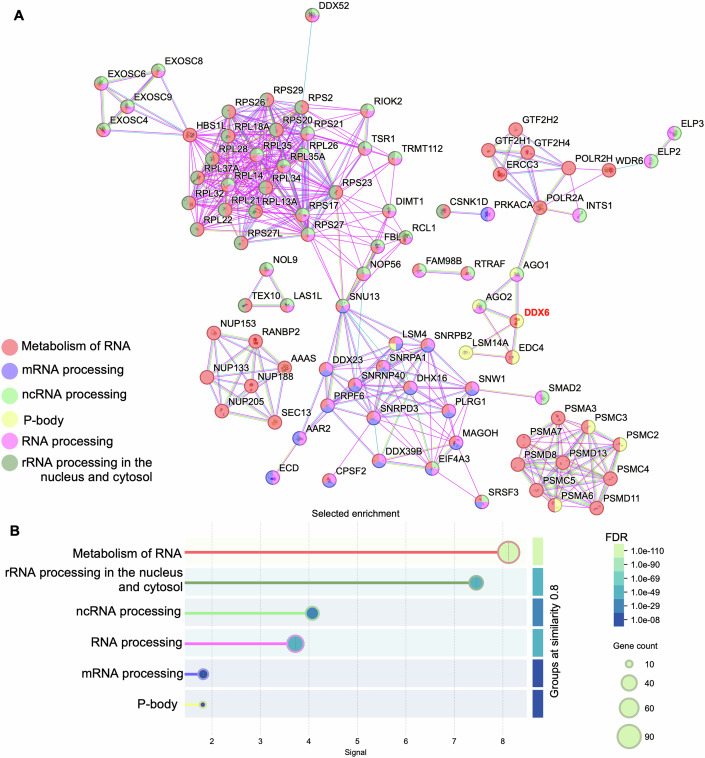
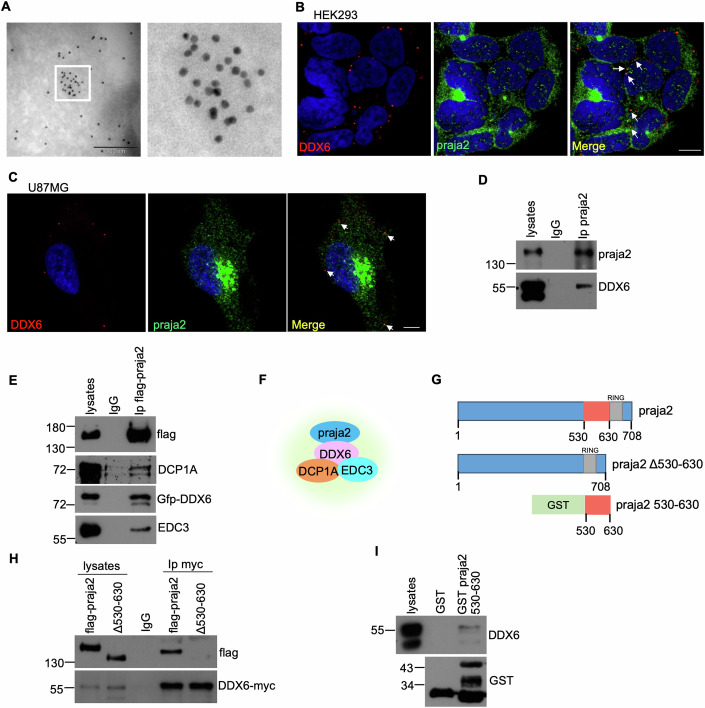
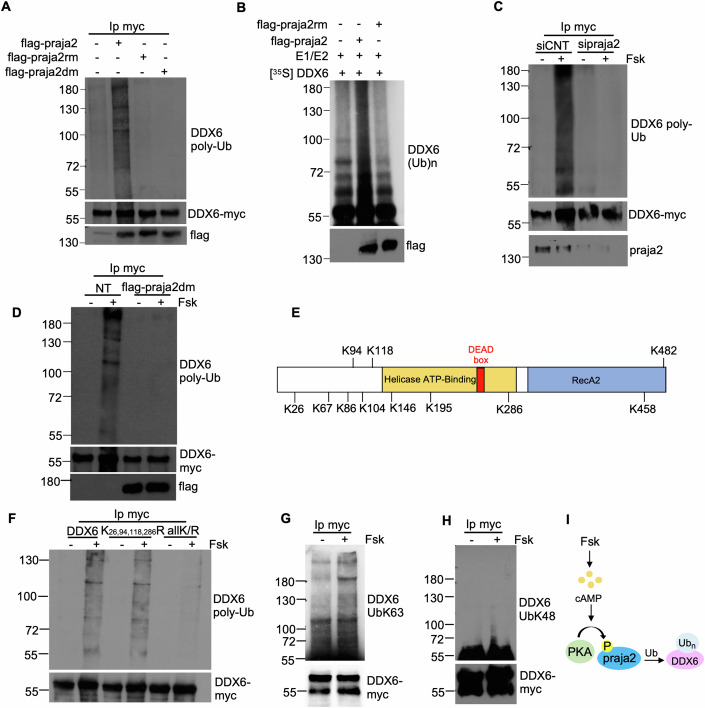
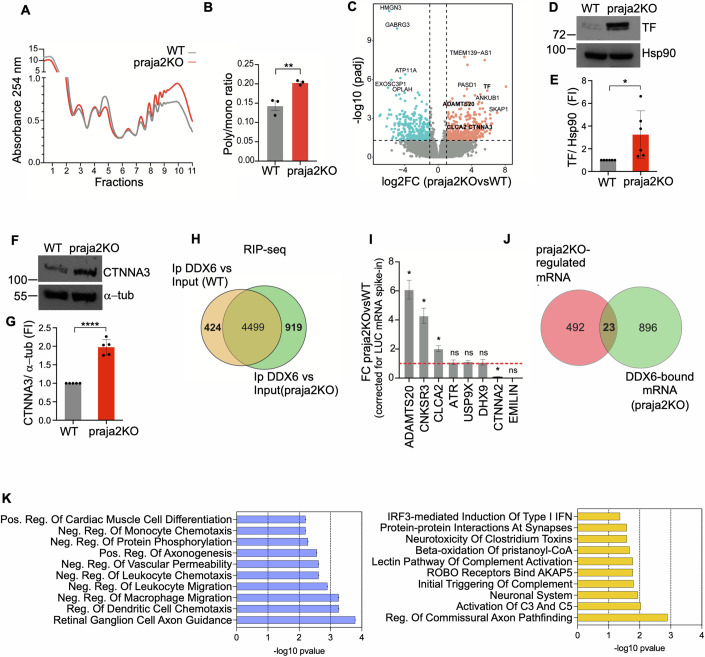
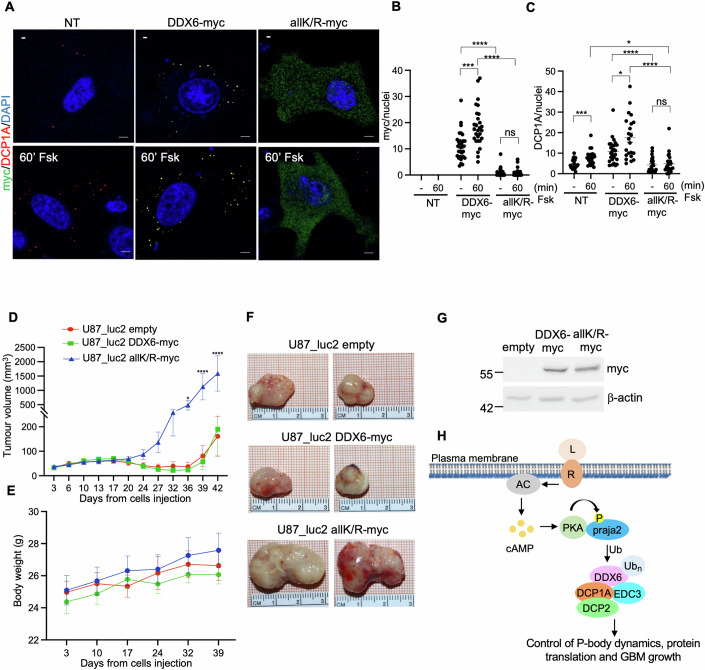
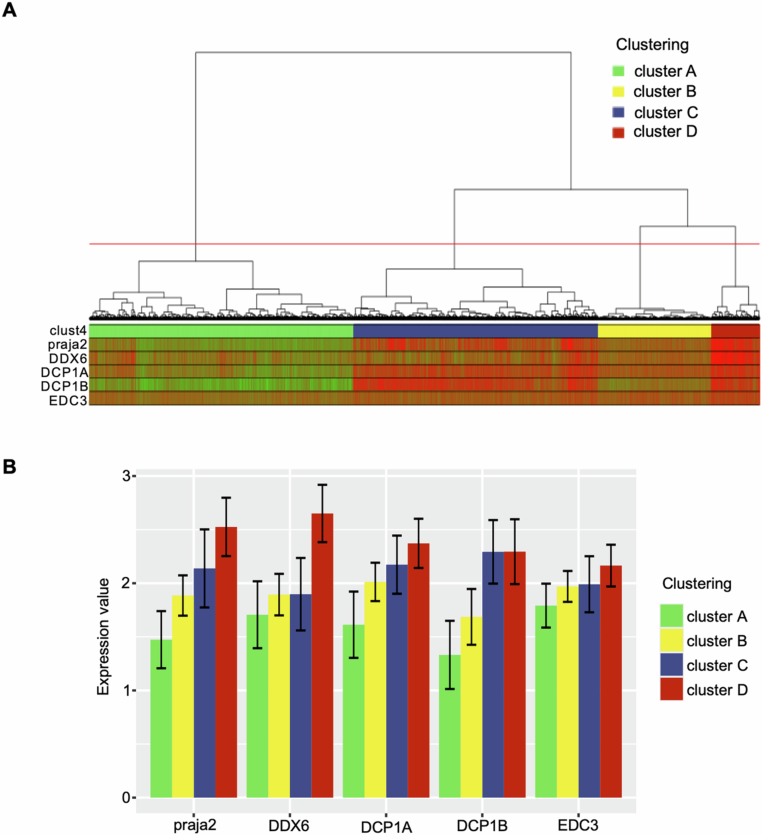
Glioblastoma multiforme (GBM) is the most lethal form of malignant brain tumor in adults. Dysregulation of protein synthesis contributes to cancer cell plasticity, driving GBM cell heterogeneity, metastatic behavior, and drug resistance. Understanding the complex network and signaling pathways governing protein translation, is therefore an important goal for GBM treatment. Here we identify a novel signaling network centered on the E3 ubiquitin ligase praja2 that controls protein translation in GBM. Praja2 forms a multimeric complex with the RNA helicase DDX6, which inhibits translation of target RNAs within processing bodies (P-bodies). Stimulation of cAMP signaling through activation of G-protein-coupled receptors induces P-body assembly through praja2-mediated non-proteolytic polyubiquitylation of DDX6. Genetic inactivation of praja2 reshapes DDX6/mRNA complexes and translating polysomes and promotes cellular senescence and GBM growth arrest. Expression of an ubiquitylation-defective DDX6 mutant suppresses the assembly of P-bodies and sustains GBM growth. Taken together, our findings identify a cAMP-driven network that controls translation in P-bodies and GBM growth.

Keywords: Glioblastoma; P-body; PKA; Praja2; cAMP.


Conflict of interest statement

Disclosure and competing interests statement. The authors declare no competing interests.

Figures

Figure 1
Figure 1. The role of praja2 in the transcriptional landscape of GBM.
(A) Volcano plot showing differentially expressed transcripts comparing RNAseq data from U87MG cells transfected with siRNA targeting endogenous praja2 (sipraja2) to negative controls (siCNT) (n = 3 biological independent replicates). FDR < 0.01 has been considered. The statistical test used for the analysis of RNAseq data was Wald test as implemented in the R package DeSeq2. (B) Heatmap of the most differentially expressed genes between sipraja2 and siCNT U87MG cells. Shown are 30 transcripts up- or downregulated. (C) Network representation of statistically significant gene sets (FDR < 0.01) enriched in siCNT (green circles) or sipraja2 (red circles) U87MG cells. Each dot displays a gene set from the Hallmark collection or GO terms from the Biological Process or Molecular Functions category. The circle size is proportional to the number of items in the gene set, and the intensity of colors is proportional to the magnitude of the enrichment score. (DH) Network representations of in silico enrichment analysis showing the correlation between praja2 expression levels and gene transcription profile of different GBM tissues dataset. Colored circles represent statistically significant gene sets (FDR < 0.01) with a significant intersection with those in (C). (D, E) are scRNA-seq datasets of two donors (701 and 702 in GSE129671 (Data ref: Ding et al, 2019)) of IDH wild-type tissue. (F) is the bulk RNAseq study of IDH wild-type GBM in The Cancer Genome Atlas repository (Data ref: TCGA-GBM; phs000178). (G) is a proteomic array of IDH wild-type GBM (PDC000204) (Data ref: Wang et al, 2021); (H) is a scRNA-seq dataset of healthy adult brain tissue (GSE67835) (Data ref: Darmanis et al, 2015). (I) Legends of macrocategories showed in (DH).
Figure 2
Figure 2. Identification of DDX6 as new interactor of praja2.
(A) Protein–protein interaction network of components involved in RNA metabolism and processing. The STRING web tool was used to query the Gene Ontology and Reactome databases for functional terms enrichment. The interactions existing between proteins involved in metabolism of RNA R-HAS-8953854 (red nodes), mRNA processing GO:0006397 (blue nodes), ncRNA processing GO:0034470 (green nodes), RNA processing GO:0006396 (pink nodes), rRNA processing in the nucleus and cytosol R-HAS-8868773 (olive green nodes) and P-bodies GO:000932 (yellow nodes) are shown (n = 107 proteins, n = 454 interactions). (B) Detailed view of the six selected enriched functional terms described in (A). The STRING web tool was used to generate a plot of enriched functional terms (Group terms by similarity >=0.8) from the Gene Ontology and Reactome databases. The signal (x axis) represents the weighted harmonic mean between the observed/expected ratio and −log(FDR) of each functional term; node size is proportional to the number of genes associated with each term while node filling colors indicate the statistical significance (FDR) of enriched terms.
Figure 3
Figure 3. Praja2 binds to and colocalizes with DDX6 at P-bodies.
(A) Electron microscopy of HeLa cells incubated with praja2 antibody. Scale bar: 200 nm. (B) Staining of HEK293 cells with anti-praja2, anti-DDX6 and DAPI. Scale bar: 5 μm. (C) Staining of U87MG cells with anti-praja2 and anti-DDX6 antibodies, and DAPI. Scale bar: 5 μm. (D) U87MG lysates were immunoprecipitated with anti-praja2. Lysates and immunoprecipitates were immunoblotted with anti-praja2 and anti-DDX6. (E) HEK293 cells were co-transfected with flag-praja2 and Gfp-DDX6. Cell lysates were immunoprecipitated with anti-flag. Lysates and immunoprecipitates were immunoblotted with anti-flag, anti-Gfp, anti-DCP1A and anti-EDC3. (F) Schematic picture of the praja2-DDX6-DCP1A-EDC3 complex. (G) Schematic model representing the deletion mutant of praja2 used. (H) HEK293 cells were co-transfected with flag-praja2 (wild-type and Δ530–630) and DDX6-myc. Cell lysates were immunoprecipitated with anti-myc. Lysates and precipitates were immunoblotted with anti-myc and anti-flag. (I) HEK293 cells were subjected to pull-down with GST and GST fused to amino acid 530–630 of praja2. Precipitates and lysates were immunoblotted with anti-GST and anti-DDX6. Source data are available online for this figure.
Figure 4
Figure 4. cAMP induces the praja2-mediated non-proteolytic ubiquitylation of DDX6.
(A) HEK293 cells were co-transfected with DDX6-myc, Ubiquitin-HA, and flag-praja2 wild-type, ring mutant (praja2rm) or phosphorylation mutant (praja2dm). Lysates were immunoprecipitated with anti-myc. Precipitates were immunoblotted with anti-HA (DDX6 poly-Ub) and anti-myc, while lysates were immunoblotted with anti-flag. (B) In vitro ubiquitylation assay of in vitro translated 35S-labeled DDX6 in the presence of flag-praja2 or flag-praja2rm precipitates, his6-tagged ubiquitin, E1, and Ubch5b enzymes. The reaction mixture was analyzed by autoradiography. An aliquot of the precipitates was immunoblotted with anti-flag. (C) HEK293 cells were co-transfected with Ubiquitin-HA, DDX6-myc, and control siRNA or siRNA targeting endogenous praja2. Cells were starved 24 h, pre-treated with MG132 (10 μM), then treated with Forskolin (Fsk) (20 μM) for 3 h and immunoprecipitated with anti-myc. Lysates were immunoblotted with anti-praja2, while precipitates with anti-HA (DDX6 poly-Ub) and anti-myc. (D) HEK293 cells were co-transfected with Ubiquitin-HA, DDX6-myc, and empty vector (NT) or flag-praja2dm. Cells were starved 24 h, pre-treated with MG132 (10 μM), then treated with Forskolin (Fsk) (20 μM) for 3 h and immunoprecipitated with anti-myc. Lysates were immunoblotted with anti-flag, while precipitates with anti-HA (DDX6 poly-Ub) and anti-myc. (E) Schematic model showing the lysine residues of DDX6 mutated in arginine in the allK/R mutant. (F) HEK293 cells were co-transfected with Ubiquitin-HA and DDX6-myc (wild-type, K26,94,118,286R or allK/R). Cells were starved 24 h, pre-treated with MG132 (10 μM), then treated with Fsk (20 μM) for 3 h and immunoprecipitated with anti-myc. Precipitates were immunoblotted with anti-HA (DDX6 poly-Ub) and anti-myc. (G) HEK293 cells were co-transfected with Ubiquitin-HA and DDX6-myc. Cells were starved 24 h, pre-treated with MG132 (10 μM), then treated with Fsk (20 μM) for 3 h and immunoprecipitated with anti-myc. Precipitates were immunoblotted with anti-Ub-K63 and anti-myc. (H) Same as in (F). Precipitates were immunoblotted with anti-Ub-K48 and anti-myc. (I) Schematic picture showing that cAMP induces praja2-mediated DDX6 ubiquitylation. Source data are available online for this figure.
Figure 5
Figure 5. cAMP promotes the assembly of P-bodies.
(A) U87MG cells were treated 30 and 60 min with Forskolin (Fsk) (10 μM). Cells were fixed and immunostained with anti-DDX6, anti-DCP1A, and DAPI. Scale bar: 10 μm. (B, C) Quantitative analysis of four biological independent experiments, mean ± SEM is indicated. t test ***P < 0.001, ****P < 0.0001 (B, 30 Fsk = 0.0005) (C, 30 Fsk = 0.0005; 60 Fsk = 0.0002). (D) GBM cells derived from patient 4 were treated 30 and 60 min with Forskolin (10 μM). Cells were fixed and immunostained with anti-DDX6, anti-DCP1A, and DAPI. Scale bar: 5 μm. (E, F) Quantitative analysis of three biological independent experiments, mean ± SEM is indicated. t test *P < 0.05, ***P < 0.001 (E, 30 Fsk = 0.0184; 60 Fsk = 0.0135) (F, 60 Fsk = 0.0003). (G) U87MG cells were treated with prostaglandin E2 (PGE2) (1 μM) for 1 h and where indicated, pre-treated 30 min with KT5720 (10 μM). Cells were fixed and stained with anti-DDX6 and DAPI. Scale bar: 5 μm. (H) Statistical analysis of three biological independent experiments, mean ± SEM is indicated. t test **P < 0.01 (− vs 60 PGE2 = 0.0039; 60 PGE2 vs 60 PGE2 + KT5720 = 0.003). (I) U87MG cells overexpressing an empty vector (NT), flag-praja2 or flag-praja2dm mutant were treated for 60 min with Fsk (10 μM), fixed and stained with anti-DDX6 and anti-flag antibodies, and DAPI. Scale bar: 5 μm. (J) Statistical analysis of four biological independent experiments, mean ± SEM is indicated. t test ****P < 0.0001. Source data are available online for this figure.
Figure 6
Figure 6. Praja2 controls P-body dynamics.
(A) U87MG (WT), U87MG praja2KO, and U87MG praja2KO cells stably expressing flag-praja2 were treated 30 and 60 min with Fsk (10 μM). Cells were fixed and immunostained with anti-DDX6 and DAPI. Scale bar: 5 μm. (B) Quantitative analysis of five biological independent experiments, mean ± SEM is indicated. t test *P < 0.05, **P < 0.01, ***P < 0.001, ****P < 0.0001 (WT− vs WT 30 Fsk=0.0003; WT− vs WT 60 Fsk= 0.0421; praja2KO− vs praja2KO+flag-praja2− = 0.0014; praja2KO 30 Fsk vs praja2KO+praja2-flag 30 Fsk= 0.0006; praja2KO+flag-praja2− vs praja2KO+flag-praja2 30 Fsk = 0.0175; praja2KO+flag-praja2− vs praja2KO+flag-praja2 60 Fsk= 0.0265). (C) Lysates from U87MG (WT), U87MG praja2KO and U87MG praja2KO+flag-praja2 cells were immunoblotted with anti-praja2 and anti-Hsp90. (D) U87MG (WT) and U87MG praja2KO cells were treated for 30–60 min with Prostaglandin E2 (PGE2) (1 μM). Cells were fixed and immunostained with anti-DDX6, anti-DCP1A, and DAPI. Scale bar: 5 μm. (E, F) Quantitative analysis of four biological independent experiments, mean ± SEM is indicated. t test *P < 0.05, **P < 0.01, ***P < 0.001, ****P < 0.0001 (E, WT - vs WT 30 PGE2 = 0.0189; WT− vs WT 60 PGE2 = 0.0299; WT 30 PGE2 vs prajaKO 30 PGE2 = 0.0005) (F, WT− vs WT 30 PGE2 = 0.0072; WT− vs WT 60 PGE2 = 0.034; WT− vs praja2KO 0 = 0.034; WT 30 PGE2 vs praja2KO 30 PGE2 = 0.0003; WT 60 PGE2 vs praja2KO 60 PGE2 = 0.0047). (G) Schematic picture showing that cAMP induces P-body assembly. Source data are available online for this figure.
Figure 7
Figure 7. Praja2 regulates DDX6-mRNA complexes and mRNA translation.
(A) Typical polysome profiles of wild-type (WT) and praja2KO U87MG cells. (B) Quantification of the polysome/monosome area ratio in wild-type and praja2KO profiles as reported in (A) (n = 3 biological independent replicates). Error bars represent SEM. Unpaired t test **P = 0.0096. (C) Volcano plot showing the significant differentially polysome-bound mRNAs in praja2KO vs U87MG wild-type cells (n = 3 biological independent replicates). The statistical analysis was performed with Wald test of Deseq2. (D) Lysates from U87MG WT and praja2KO cells were immunoblotted with anti-TF and anti-Hsp90. (E) Quantitative analysis of six biological independent experiments as reported in (D), mean ± SD is indicated. t test *P = 0.0254. (F) Lysates from U87MG WT and praja2KO cells were immunoblotted with anti-CTNNA3 and anti-α-tubulin. (G) Quantitative analysis of five biological independent experiments as reported in (F), mean ± SD is indicated. t test ****P < 0.0001. (H) Overlap between DDX6-bound mRNAs in WT and praja2KO U87MG cells. (I) Validation of DDX6 targets by RT-qPCR. Results are shown as fold change of praja2KO vs WT U87MG cells (n = 3). Levels of immunoprecipitated mRNA were corrected for Luciferase mRNA spike-in control. EMILIN was used as a negative control. Error bars represent SEM. Statistical significance was assessed by one-sample t test *P < 0.05 (ADAMTS20 = 0.016; CNKSR3 = 0.0243; CLCA2 = 0.0371; CTNNA2 < 0.0001). (J) Overlap between praja2 translationally regulated mRNAs and DDX6 mRNAs bound only in the absence of praja2. (K) Gene ontology analysis of 23 transcripts identified in (J). Biological processes (left panel) and pathway enrichment analysis (right panel) are shown. Source data are available online for this figure.
Figure 8
Figure 8. Praja2 deletion induces cellular senescence and GBM growth arrest.
(A) β-galactosidase staining at pH 6 on U87MG WT and praja2KO cells. Scale bar: 40 μm. (B) Quantitative analysis of three biological independent experiments as reported in (A), mean ± SD is indicated. t test ****P < 0.0001. (C) Lysates from U87MG (WT) and praja2KO cells were immunoblotted with anti-p21 and anti-α-tubulin. (D) Quantitative analysis of three biological independent experiments as reported in (C), mean ± SD is indicated. t test *P = 0.0459 (E). 5 × 106 U87MG (WT) and U87MG praja2KO cells were implanted into CD1 nude mice. Six weeks later, the mice were killed, and the tumors were excised and weighed. Tumor sections were fixed and doubly stained with hematoxylin/eosin or subjected to immunohistochemistry with anti-praja2 antibody. Scale bar (referred to ×40 magnification): 50 μm. (F) Quantitative analysis of the tumors size (at 6 weeks) shown in (E). Three WT and four praja2KO mice were analyzed. Data are expressed as mean value ± SEM. t test *P = 0.0441 (G). Representative imaging of immunostaining for ki67, p53, and p21 in mice subcutaneously injected with U87MG (WT) (upper panels) or U87MG praja2KO (lower panels) cells. Scale bar (referred to ×40 magnification): 50 μm. Source data are available online for this figure.
Figure 9
Figure 9. DDX6 ubiquitylation controls P-bodies assembly and GBM growth.
(A) U87MG cells overexpressing an empty vector (NT), DDX6-myc or DDX6 allK/R-myc mutant were treated for 60 min with Fsk (10 μM), fixed and immunostained with anti-DCP1A, anti-myc and DAPI. Scale bar: 5 μm. (B, C) Quantitative analysis of five biological independent experiments is shown, mean ± SEM is indicated. t test *P < 0.05, ***P < 0.001, ****P < 0.0001 (B, DDX6-myc− vs DDX6-myc 60 Fsk= 0.0001) (C, NT – vs NT 60 Fsk = 0.0003; DDX6-myc− vs DDX6-myc 60 Fsk = 0.0115; NT 60 Fsk vs allK/R-myc 60 Fsk= 0.0251). (D) In all, 2.5 × 106 U87MG-luc cells infected with empty vector, or with a vector expressing DDX6-myc or allK/R-myc mutant were subcutaneously implanted into nude mice. Cumulative data of tumor volume measured twice a week are expressed as mean ± SEM. Six mice for each experimental group were used. two-way ANOVA *P < 0.05, ****P < 0,0001 (36 days empty vs allK/R-myc = 0.0231; 36 days DDX6-myc vs allK/R-myc = 0.0186). (E) Cumulative data of mice body weight measured once a week are expressed as mean ± SEM. Six mice for each experimental group were used. (F) Representative images of tumors excised 46 days post-injection are shown. (G) Lysates from U87MG_luc cells infected with empty virus or with lentiviral particles carrying DDX6-myc or allK/R-myc transgene were immunoblotted with anti-myc and anti-β-actin antibodies. (H) Stimulation of G-protein-coupled receptor (R) by a ligand (L) activates adenylate cyclase (AC), raises cAMP levels, and activates protein kinase A (PKA). PKA phosphorylates and activates praja2 that, in turns, polyubiquitylates DDX6. Ubiquitylated DDX6 controls P-body assembly, mRNA translation and GBM growth. Source data are available online for this figure.
Figure EV1
Figure EV1. Praja2 protein–protein interaction network.
Protein–protein interaction network of all the directly-interacting components belonging to the praja2 interactome, which was generated using the inBio Discover web tool (no network expansion) based on highly trusted interactions (n = 506 proteins, n = 1563 interactions). The figure legend indicates the functional roles of the displayed interactors.
Figure EV2
Figure EV2. Praja2 interacts with components of metabolism of RNA pathway.
(A) Barplot showing the Top5 most enriched REACTOME terms derived from the analysis of praja2-PPI network. (B) Protein–protein interaction network of components involved in cell cycle, response to stress and metabolism, which was generated using the inBio Discover web tool (no network expansion) querying the Reactome database for functional enrichment. The interactions existing between proteins involved in cell cycle (blue nodes), cell cycle, mitotic (cyan nodes), cellular responses to stress (green nodes), metabolism of proteins (purple nodes) and metabolism of RNA (magenta nodes) are shown (n = 237 proteins, n = 762 interactions).
Figure EV3
Figure EV3. Praja2 is a potential regulator of mRNA translation.
(A) Unsupervised hierarchical clustering of 20.000 cells from IDH wild-type GBM donor 701 (GSM3719277). The first annotation bar is the primary statistical clustering, while other bars show expression levels of the indicated genes (green= low expression, red= high expression). (B) Gene expression level across clusters. The bar graphs show each cluster’s mean of gene expression levels of praja2, DDX6, DCP1A, DCP1B, and EDC3. Data from 20000 cells were used. Values represent the mean ± SD.
Figure EV4
Figure EV4. cAMP induces P-body formation.
(A) GBM cells derived from patient 3 were treated 30 and 60 min with Forskolin (10 μM). Cells were fixed and immunostained with anti-DDX6, anti-DCP1A and DAPI. Scale bar: 5 μm. (B, C) Quantitative analysis of three biological independent experiments, mean ± SEM is indicated. t test *P < 0,05 (B, P = 0.0413; C, P = 0.0213). Source data are available online for this figure.
Figure EV5
Figure EV5. Praja2 regulates transcriptome of GBM cells.
(A) Volcano plot showing log2FC and P value adjusted distribution of all genes, in particular down and upregulated differentially expressed (DE) genes comparing praja2KO versus WT cells are presented in green and red, respectively (n = 3 independent biological replicates). The statistical analysis was performed with Wald test of Deseq2. (B) Enrichment results of Ingenuity Pathways Analysis on DE genes, the size of the bubble indicates the number of enriched genes for each term. Statistical analysis performed with Fisher’s Exact Test.

References

    1. Arribas-Layton M, Dennis J, Bennett EJ, Damgaard CK, Lykke-Andersen J (2016) The C-terminal RGG domain of human Lsm4 promotes processing body formation stimulated by arginine dimethylation. Mol Cell Biol 36:2226–2235 - PMC - PubMed
    1. Ayache J, Bénard M, Ernoult-Lange M, Minshall N, Standart N, Kress M, Weil D (2015) P-body assembly requires DDX6 repression complexes rather than decay or Ataxin2/2L complexes. Mol Biol Cell 26:2579–2595 - PMC - PubMed
    1. Bearss JJ, Padi SK, Singh N, Cardo-Vila M, Song JH, Mouneimne G, Fernandes N, Li Y, Harter MR, Gard JM et al (2021) EDC3 phosphorylation regulates growth and invasion through controlling P-body formation and dynamics. EMBO Rep 22:e50835 - PMC - PubMed
    1. Bhat M, Robichaud N, Hulea L, Sonenberg N, Pelletier J, Topisirovic I (2015) Targeting the translation machinery in cancer. Nat Rev Drug Discov 14:261–278 - PubMed
    1. Bidwell P, Joh K, Leaver HA, Rizzo MT (2010) Prostaglandin E2 activates cAMP response element-binding protein in glioma cells via a signaling pathway involving PKA-dependent inhibition of ERK. Prostaglandins Other Lipid Mediators 91:18–29 - PubMed

MeSH terms

LinkOut - more resources