. 2025 May;10(5):1171-1183.
doi: 10.1038/s41564-025-01975-z. Epub 2025 Mar 27.

Inducible transposon mutagenesis identifies bacterial fitness determinants during infection in mice

Affiliations

Inducible transposon mutagenesis identifies bacterial fitness determinants during infection in mice

David W Basta et al. Nat Microbiol. 2025 May.

Abstract

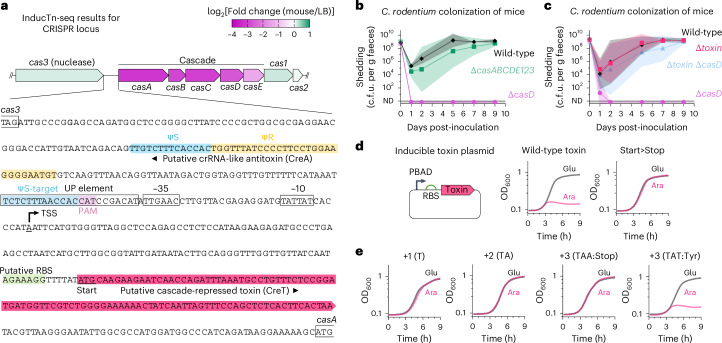
Transposon insertion sequencing (Tn-seq) is a powerful method for genome-scale forward genetics in bacteria. However, inefficient transposon delivery or stochastic loss of mutants due to population bottlenecks can limit its effectiveness. Here we have developed 'InducTn-seq', where an arabinose-inducible Tn5 transposase enables temporal control of mini-Tn5 transposition. InducTn-seq generated up to 1.2 million transposon mutants from a single colony of enterotoxigenic Escherichia coli, Salmonella typhimurium, Shigella flexneri and Citrobacter rodentium. This mutant diversity enabled more sensitive detection of subtle fitness defects and measurement of quantitative fitness effects for essential and non-essential genes. Applying InducTn-seq to C. rodentium in a mouse model of infectious colitis bypassed a highly restrictive host bottleneck, generating a diverse population of >5 × 10⁵ unique transposon mutants compared to 10-102 recovered by traditional Tn-seq. This in vivo screen revealed that the C. rodentium type I-E CRISPR system is required to suppress a toxin otherwise activated during gut colonization. Our findings highlight the potential of InducTn-seq for genome-scale forward genetic screens in bacteria.


Conflict of interest statement

Competing interests: The authors declare no competing interests.

Figures

Fig. 1
Fig. 1. InducTn-seq enables genome-scale forward genetics through inducible mutagenesis.
a, Traditional Tn-seq is often limited by the inefficient delivery of a transposon donor, which impedes the generation of a diverse mutant population. By contrast, InducTn-seq allows for the expansion of a single initial transconjugant (depicted as a grey colony) to generate a diverse mutant population. b, During animal colonization experiments, an initial host bottleneck leads to the random elimination of mutant cells, thereby reducing the diversity of the mutant population. With InducTn-seq, new transposon mutants can be generated within the animal after bypassing the initial bottleneck. Parts of this figure were created in BioRender.com.
Fig. 2
Fig. 2. Design of an inducible mutagenesis system.
a, Diagram of the inducible transposon mutagenesis plasmid, pTn donor. The plasmid backbone contains a carbenicillin-selectable marker (carbR), a conditional origin of replication (R6k) and an RP4 origin of transfer (oriT). The mini-Tn7 transposon (green brackets) contains a Tn5 transposase regulated by the arabinose-responsive PBAD promoter (cyan), a mini-Tn5 transposon with a kanamycin-selectable marker (kanR, purple), and a transcriptionally silenced gentamicin-selectable marker (gentR, grey). The Tn5 transposase and transposon form the Tn5 transposition complex, which is flanked by Cre-recognized lox sequences. Cre excision of the complex enables the measurement of the population-level transposition frequency (Extended Data Fig. 2 provides details). Following integration of the mini-Tn7 transposon at the attTn7 site (green arrow), arabinose-mediated induction of the Tn5 transposase results in random mini-Tn5 transposition out of the attTn7 site (purple arrow). b, The frequency of mini-Tn5 transposition out of the attTn7 site after growth in the presence or absence of arabinose, expressed as the ratio of kanR + gentR c.f.u. to gentR c.f.u. (see Extended Data Fig. 2 for details). Columns represent means, error bars represent s.d., and points represent biological replicates (n = 7 for each condition). c, The number of unique mini-Tn5 insertion sites in a population of ~103 E. coli MG1655 colonies after growth with or without arabinose (induced or uninduced, respectively). One hundred nanograms of template DNA was used for amplification of each sequencing library. d, Histogram displaying the number of mini-Tn5 transposons inserted into the genome of ten colonies that underwent at least one Tn5 transposition event after arabinose induction.
Fig. 3
Fig. 3. Sensitive measurement of mutant fitness in both essential and non-essential genes.
a, Induced cells (ON) contain mini-Tn5 insertions in genes classified as essential in the closely related E. coli strain BW25113 (genes depicted in red, for example, obgE). a,b, Insertions in essential genes are selectively depleted when the population is expanded in the absence of induction (a), and progressively decrease with more generations of growth (b). In b, the ON population was serially diluted in LB without induction, ensuring logarithmic growth of the population over 17 generations. Individual lines in b correspond to the genes displayed in a. Supplementary Table 2 provides a complete list of all genes. c, Volcano plot comparing the fold change in the gene insertion frequency between OFF and ON. A significant fitness defect was defined as a two-sided Mann–Whitney U-test P value of <0.01 (adjusted for multiple comparisons with the Benjamini–Hochberg correction) and log2(fold change) < −1 relative to the frequency of insertions in the ON population. Genes previously classified as essential are marked as red points.
Fig. 4
Fig. 4. InducTn-seq creates high-density mutant populations from a single bacterium.
a, The indicated enteric pathogens underwent conjugation with pTn donor and pTn7 helper. The transposition frequency is expressed as the ratio of kanR c.f.u. to total c.f.u. The columns represent means and the points represent biological replicates (n = 2 for each strain). b, A single, uninduced transconjugant colony of each strain was streaked onto a plate containing 0.2% arabinose. c, The number of unique mini-Tn5 insertion sites detected by sequencing of the streaked populations expanded from a single colony.
Fig. 5
Fig. 5. InducTn-seq bypasses the host bottleneck to enable identification of C. rodentium colonization factors.
a, Female C57BL/6J mice were intragastrically inoculated with either a pool of ~3 × 105 unique C. rodentium mini-Tn5 insertion mutants (traditional Tn-seq, n = 4) or uninduced Tn5 transposition complex integrants (InducTn-seq). Colonization was monitored by serial dilution and plating of faeces. For InducTn-seq, mini-Tn5 transposition was induced from days 3 to 8 by providing ad libitum access to water containing 5% arabinose (induced InducTn-seq, n = 20; uninduced InducTn-seq, n = 8). No difference in log10(c.f.u.) was observed between arabinose induction and either uninduced or traditional Tn-seq by two-sided restricted maximum likelihood mixed-effects analysis with Šídák’s correction for multiple comparisons (adjusted P > 0.01). b, Frequency of mini-Tn5 transposition out of the attTn7 site after growth of the InducTn-seq inoculum in the presence or absence of arabinose, either in culture or in mice (n = 4 in inoculum, culture minus arabinose, culture plus arabinose and mouse minus arabinose; n = 7 in mouse plus arabinose). c, Histogram showing the number of mini-Tn5 transposons inserted into the genome of nine colonies that underwent at least one Tn5 transposition event following arabinose induction in the mouse. d, Samples from day 5 (traditional Tn-seq) or day 8 (InducTn-seq) post-inoculation were sequenced to determine the number of unique mutants recovered from each animal (n = 3 mice in each group). e, Correlation of mutant frequency between animal replicates. Points represent genes. Insertion frequency is calculated as reads per gene normalized to total reads in the sample, and histograms on the axes display the distribution of the data. f, Coefficient of determination (R2) comparing the log10-transformed insertion frequencies across replicates. g, Volcano plot comparing fold change in the gene insertion frequency between mouse and LB. The average log2(fold change) and −log10(P value) of a two-sided Mann–Whitney U-test adjusted for multiple comparisons with the Benjamini–Hochberg correction is shown for three biological replicates. Colonization factors are shown in blue and are defined as genes meeting a cutoff of P < 0.01 and log2(fold change) < −1 in at least two out of three animal replicates (Supplementary Table 7). Genes within the LEE are shown in red. h, KEGG enrichment analysis of colonization factors displaying pathways with q-value < 0.05. Enrichment factor is defined as the fraction of genes within the pathway that are colonization factors. Data in a and b are presented as geometric mean values ± s.d.
Fig. 6
Fig. 6. A Cascade-repressed toxin is activated during gut colonization.
a, Diagram of the C. rodentium type I-E CRISPR locus overlaid with a heatmap of the average log2(fold change) in insertion frequency comparing mouse to LB. Genes encoding Cascade (casABCDE), but not the nuclease encoded by cas3, are required for fitness during enteric infection. The intergenic sequence between cas3 and casA is expanded to show the putative 96-bp toxin (CreT, red). The start codon of CreT is underlined. The repeat-like (ΨR, yellow) and spacer-like (ΨS, blue) segments of the putative crRNA-like antitoxin (CreA) are highlighted. A potential target sequence (ΨS-target) with partial complementarity to ΨS overlaps with the predicted UP element and is adjacent to a canonical Cascade-recognized protospacer adjacent motif (PAM, 5′-ATG-3′). b,c, Bacterial shedding in female C57BL/6J mice colonized with wild-type C. rodentium or the indicated deletion strains was monitored by serial dilution and plating of faeces (n = 4 mice per strain (b); n = 6 mice per strain (c)). d,e, The putative CreT toxin (d) or its indicated variants (d,e) were placed on a plasmid under the control of the arabinose-responsive PBAD promoter and transformed into C. rodentium. All constructs retained the predicted RBS and the upstream promoter elements were replaced by the PBAD promoter. Growth was measured for each variant in LB supplemented with 0.2% arabinose or 0.2% glucose. The average growth curve of four biological replicates derived from independently picked transformants is shown. Nucleotides (+1/+2/+3) were inserted after the putative creT start codon in e. OD600, optical density at 600 nm. Data in b and c are presented as geometric mean values ± s.d.
Extended Data Fig. 1
Extended Data Fig. 1. Comparison of mini-Tn5 and mini-Tn7 integration frequencies.
a, The non-replicative pTn donor plasmid can be used to create a traditional transposon mutant population through a one-time, random mini-Tn5 transposon integration, mediated by the Tn5 transposase, immediately after the plasmid is introduced into recipient cells. Alternatively, it can be used to create an inducible population by co-introduction of the Tn7 helper plasmid (expressing the Tn7 integration machinery), wherein transposon mutants are generated following the site-specific integration of the Tn5 transposition complex at the attTn7 site in the genome. b, Integration at the attTn7 site or random mini-Tn5 integration both result in kanamycin resistance. However, integration is ~30-fold more efficient when the Tn7 helper plasmid is present, indicating that most kanamycin-resistant colonies (total transposon integrants) represent cells containing the Tn5 transposition complex at the attTn7 site rather than random mini-Tn5 mutants. The integration frequency is expressed as the ratio of kanR c.f.u to total c.f.u. The columns represent means, the error bars represent standard deviation, and the points represent biological replicates (n = 4 without pTn7 helper and n = 5 with pTn7 helper).
Extended Data Fig. 2
Extended Data Fig. 2. A Cre recombinase-based indicator of transposition frequency at the population level.
Following outgrowth of attTn7 site-specific integrants, an optional second conjugation step can be performed to determine the population-level frequency of mini-Tn5 transposition out of the attTn7 site. When a plasmid expressing the Cre recombinase is introduced into the mutant population, Cre expression leads to excision of the Tn5 transposition complex at the attTn7 site via recombination of the lox sequences. Cre excision causes recipient cells to simultaneously lose the attTn7-site kanamycin marker and activate expression of the gentamicin marker. Cells that did not undergo mini-Tn5 transposition prior to Cre excision of the Tn5 transposition complex become solely resistant to gentamicin, while cells that did undergo transposition retain a copy of the mini-Tn5 transposon at a random genomic location outside of the mini-Tn7 lox sites, rendering them resistant to both kanamycin and gentamicin. The ratio of gentR+kanR to gentR colonies provides a measure of transposition frequency in cells where the Tn5 transposition complex was initially integrated at the attTn7 site (Fig. 2b).
Extended Data Fig. 3
Extended Data Fig. 3. Total mutant diversity depends on the amount of DNA sampled.
Increasing the amount of template DNA used in amplification of the InducTn-seq library increases the number of unique insertions detected. ‘Total’ represents the sum of the 100, 200, and 400 ng samples. The 100 ng sample in this figure is the same as ‘Induced’ in Fig. 2c.
Extended Data Fig. 4
Extended Data Fig. 4. Comparison of InducTn-seq to traditional Tn-seq.
a, Venn diagram of E. coli MG1655 genes classified as having a fitness defect by InducTn-seq (log2 fold change <−1 and P value < 0.01 of a two-sided Mann-Whitney U test adjusted for multiple comparisons with the Benjamini-Hochberg correction) and E. coli BW25113 genes classified as ‘essential’ by TraDIS. 331 genes were commonly identified between the two screens, representing a 93.5% overlap. The discordant genes identified only by TraDIS were on average (b) shorter and (c) more AT rich. d, Genes exclusively identified by InducTn-seq generally had weaker fitness defects than genes concordantly identified by the two screens, suggesting that these genes may have subtle growth rate defects but are not strictly essential for growth.
Extended Data Fig. 5
Extended Data Fig. 5. InducTn-seq gene-level fitness analysis of C. rodentium enteric colonization.
Extended results of select genes from Fig. 5g are shown for each animal replicate. C. rodentium mutants induced during infection and then expanded on solid LB are compared to mutants induced in culture and then expanded on solid LB. Log2 fold-change and the two sided, Benjamini-Hochberg corrected, −log10 Mann-Whitney U P value is shown.
Extended Data Fig. 6
Extended Data Fig. 6. Toxin expression is titratable.
C. rodentium growth with a plasmid-borne copy of the wild-type toxin or its nonsense variant under the control of the arabinose-responsive PBAD promoter. Arabinose induction increases toxin activity in a dose-dependent manner. The average growth curve of 2-3 biological replicates is shown.

Update of

References

    1. Van Opijnen, T., Bodi, K. L. & Camilli, A. Tn-seq: high-throughput parallel sequencing for fitness and genetic interaction studies in microorganisms. Nat. Methods6, 767–772 (2009). - PMC - PubMed
    1. Goodman, A. L. et al. Identifying genetic determinants needed to establish a human gut symbiont in its habitat. Cell Host Microbe6, 279–289 (2009). - PMC - PubMed
    1. Langridge, G. C. et al. Simultaneous assay of every Salmonella Typhi gene using one million transposon mutants. Genome Res.19, 2308–2316 (2009). - PMC - PubMed
    1. Gawronski, J. D., Wong, S. M. S., Giannoukos, G., Ward, D. V. & Akerley, B. J. Tracking insertion mutants within libraries by deep sequencing and a genome-wide screen for Haemophilus genes required in the lung. Proc. Natl Acad. Sci. USA106, 16422–16427 (2009). - PMC - PubMed
    1. Chao, M. C., Abel, S., Davis, B. M. & Waldor, M. K. The design and analysis of transposon insertion sequencing experiments. Nat. Rev. Microbiol.14, 119–128 (2016). - PMC - PubMed

LinkOut - more resources