. 2025 Apr;10(4):992-1005.
doi: 10.1038/s41564-025-01967-z. Epub 2025 Mar 27.

Immune targeting and host-protective effects of the latent stage of Toxoplasma gondii

Affiliations

Immune targeting and host-protective effects of the latent stage of Toxoplasma gondii

Julia N Eberhard et al. Nat Microbiol. 2025 Apr.

Abstract

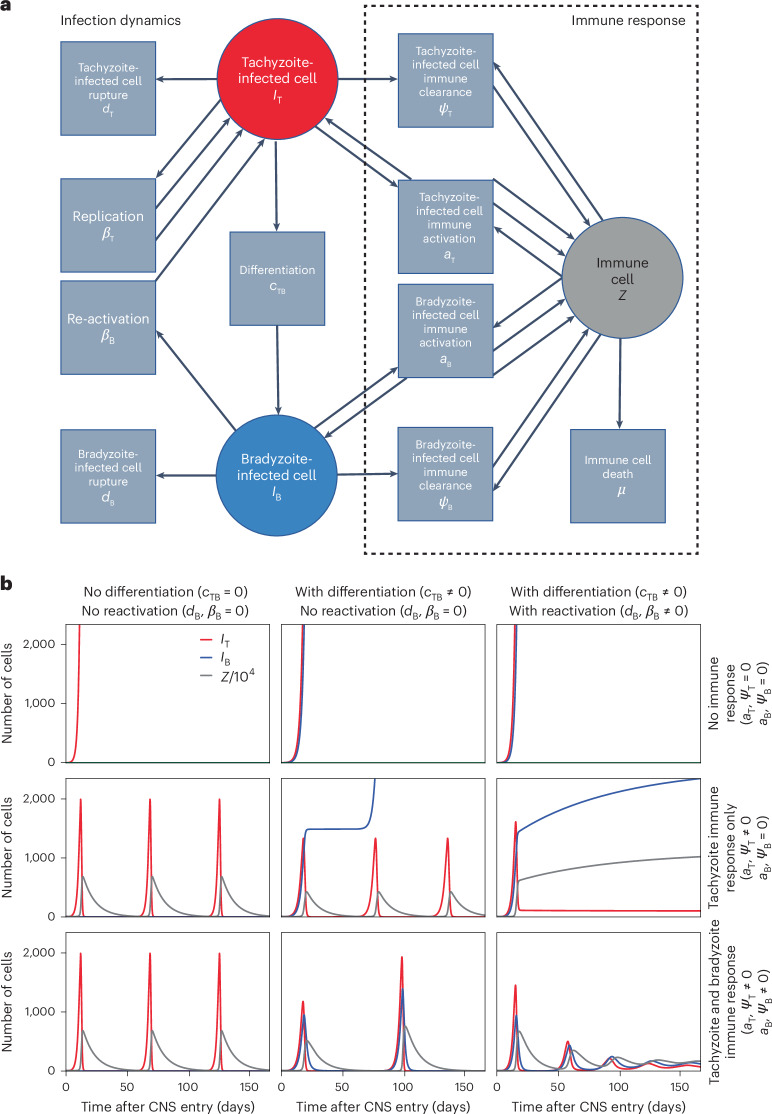
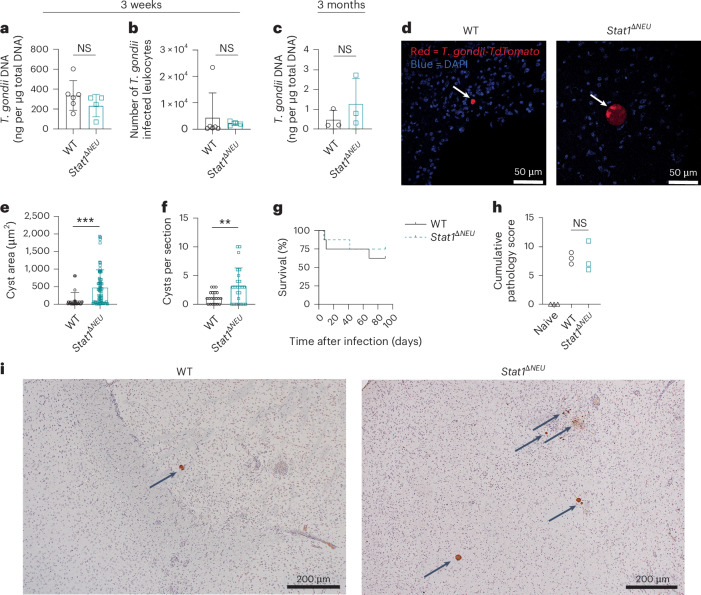
Latency is a microbial strategy for persistence. For Toxoplasma gondii the bradyzoite stage forms long-lived cysts critical for transmission, and its presence in neurons is considered important for immune evasion. However, the extent to which cyst formation escapes immune pressure and mediates persistence remained unclear. Here we developed a mathematical model highlighting that bradyzoite-directed immunity contributes to control of cyst numbers. In vivo studies demonstrated that transgenic CD8+ T cells recognized a cyst-derived antigen, and neuronal STAT1 signalling promoted cyst control in mice. Modelling and experiments with parasites unable to form bradyzoites (Δbfd1) revealed that the absence of cyst formation in the central nervous system did not prevent long-term persistence but resulted in increased tachyzoite replication with associated tissue damage and mortality. These findings suggest the latent form of T. gondii is under immune pressure, mitigates infection-induced damage and promotes survival of host and parasite.


Conflict of interest statement

Competing interests: The authors declare no competing interests.

Figures

Fig. 1
Fig. 1. Compartmental modelling of T. gondii infection in the CNS predicts the presence of immune responses to tachyzoites and bradyzoites.
a, Petri net representing the infection (left) and immune response (right) dynamics in equations (1)–(3). Circles represent different cell populations: tachyzoite- (IT, red) or bradyzoite-infected (IB, blue) cells and immune cells (Z, grey). Squares represent a particular reaction. Arrows entering a square represent reactants, and those leaving represent products. The two arrows from βT to IT represent a +1 increase in parasite numbers, and similarly, two arrows from αT (αB) to Z represent the ability of tachyzoite (bradyzoite)-infected cells to amplify the immune response. b, Graphical representations of potential outcomes for the numbers of tachyzoite-infected cells (IT, red), bradyzoite-infected cells (IB, blue) and immune cells (Z, grey) after parasite entry into the CNS, based on equations (1)–(3). Columns show different parasite dynamics: no parasite differentiation nor reactivation (cTB = 0 and dB, βB = 0; left column), differentiation but no reactivation (cTB ≠ 0 and dB, βB = 0; middle column), or both differentiation and reactivation (cTB ≠ 0 and dB, βB ≠ 0; right column). Rows show different immune responses: no immune response (aT, ψT = 0 and aB, ψB = 0; top row), immune responses against tachyzoites only (aT, ψT ≠ 0 and aB, ψB = 0; middle row), or immune responses against tachyzoites and bradyzoites (aT, ψT ≠ 0 and aB, ψB ≠ 0; bottom row). When nonzero, the parameters used were S0 = 108, IT (0) = 1, IB(0) = 0, Z(0) = 105, dT = 0.2, dB = 0.01, βT = 1.7, βB = 0.2, cTB = 0.25, aT = 105, aB = 0.2 × 105, µ = 0.1, ψT = 50, ψB = 10.
Fig. 2
Fig. 2. Cyst-derived antigen induces a CD8+ T-cell response in the CNS.
a, Transgenic parasite constructs for constitutive (tub1-OVA) and bradyzoite (bag1-OVA) restricted OVA expression. Expression of truncated OVA was linked to the secretion signal p30 and driven by either the TUB1 or BAG1 promoter. b, Experimental design for cm. C57BL/6J mice were infected with tub1-OVA or bag1-OVA parasites (n = 7 mice per group). At 21 d.p.i., naive congenically distinct (CD45.1+CD45.2+) Nur77GFP OT-I T cells were transferred intravenously. Brains were collected at 35–45 d.p.i., and OT-I T cells were analysed by flow cytometry. c, Frequency and number of OT-I T cells (****P < 0.0001). d, Frequency and geometric mean fluorescence intensity (gMFI) of Nur77GFP expression in OT-I T cells shown in c (*P = 0.0176, **P = 0.0024). e,f, UMAP analysis (e) and unsupervised clustering (f) of OT-I T cells pooled from tub1-OVA and bag1-OVA infected brains. Colours represent 7 individual clusters identified through X-shift clustering analysis. g, Heat maps showing MFI of individual phenotypic markers across the 7 clusters identified in f. hk, Flow cytometric profiling of OT-I T cells based on expression of KLRG1 and CX3CR1 (h), T-bet (i), CD69 and CD103 (j) and PD-1 (k). Grey histogram sample indicates expression by naive CD8+ T cells (in h, ***P = 0.000311, ****P < 0.00001; in i, ****P < 0.0001; in j, ****P < 0.0001; in k, ****P < 0.0001). l,m, OT-I degranulation (l) and intracellular IFN-γ staining (m) after 4 h restimulation with SIINFEKL peptide. Grey indicates unstimulated OT-I T-cell controls (in m, ****P < 0.0001). Data are representative plots from three independent experiments. Data analysed by two-sided unpaired Student’s t-test. Bonferroni–Dunn correction for multiple comparisons included in statistical analyses performed in f and h. NS, P > 0.05. Bar graphs depict the mean ± s.d. Source data
Fig. 3
Fig. 3. Neuronal STAT1 mediates cyst control during chronic T. gondii infection.
C57BL/6J (WT) and Stat1ΔNEU mice were infected with tdTomato+ T. gondii parasites, and brains were analysed at 3 weeks post-infection (w.p.i.; in a and b) or 3 m.p.i. (in cf, h and i). a,b, Quantification of CNS parasite burden at 3 w.p.i. by qPCR (a) and flow cytometry for tdTomato+ tachyzoite-infected CD45+ leukocytes (b; WT, n = 6 mice; Stat1ΔNEU, n = 4 mice). c, Quantification of CNS parasite burden at 3 m.p.i. by qPCR (n = 3 mice per group). d, Fluorescent imaging of brains at 3 m.p.i. (tdTomato+ parasites (red), DAPI (blue) and white arrows indicate T. gondii cysts; scale bars, 50 μm). e,f, Brain cyst area (e; ***P = 0.0006) and number (f; **P = 0.0091) at 3 m.p.i. (WT, n = 5 mice; Stat1ΔNEU, n = 6 mice). Cysts were identified as vacuoles with >32 parasites. g, Survival of infected WT and Stat1ΔNEU mice (n = 8 mice per group). h, Cumulative semiquantitative pathological scores of brain sections at 3 m.p.i. (n = 3 mice per group). i, IHC for T. gondii on sections from the brains scored in h. Images depict the cerebrum and midbrain (WT) or cerebrum (Stat1ΔNEU). Arrows indicate T. gondii cysts (scale bars, 200 μm). Data are representative plots from two independent experiments. Data analysed by two-sided unpaired Student’s t-test in ac,e and f or two-sided Mann–Whitney test in h; NS, P > 0.05. Bar graphs depict the mean ± s.d. Source data
Fig. 4
Fig. 4. Latent stage conversion is not necessary for chronic infection.
a,b, Model predictions of CNS infection dynamics with or without parasite conversion from tachyzoites to bradyzoites (cTB). a, Early dynamics of CNS tachyzoite (IT, red) and bradyzoite (IB, blue) infected cells with cyst conversion (cTB = 0.25; left) or without (cTB = 0; right). b, Long-term dynamics of CNS tachyzoite infected populations with cTB = 0.25 or cTB = 0. cg, C57BL/6J mice were infected with WT or ∆bfd1 parasites. Brains were collected and analysed as described. c, Quantification of tdTomato+ tachyzoite-infected CD45+ leukocytes in the brain, analysed by flow cytometry (WT-infected, n = 3 or 4 mice per time point; ∆bfd1-infected, n = 3 or 5 mice per time point; ***P = 0.0017, ****P = 0.0004; data representative of 2 independent experiments). d, Fluorescent imaging of neurons, astrocytes, T. gondii parasites and cysts in the brain at 25 d.p.i. (NeuN, MAP2 and neurofilament (red); GFAP (cyan); tdTomato+ T. gondii (green); DBA (magenta). Scale bars, 10 μm). e, Percentage normalization of DBA-stained vacuoles at 25 d.p.i. (WT, n = 2 vacuoles; bfd1KO, n = 4 vacuoles; ****P = <0.0001). f,g, WT- and ∆bfd1-infected mice were treated with 200 μg per dose of isotype (WT-infected, ∆bfd1-infected, n = 3 mice) or α-IFNγ antibody (WT-infected, n = 5 mice; ∆bfd1-infected, n = 4 mice) twice per week for 4 weeks before collection at 6 m.p.i. (data representative of 1 experiment). f, Representative H&E photomicrographs of brains from infected mice at 6 m.p.i. (brainstem, upper left; cerebrum, all other panels). Arrows indicate areas of T. gondii tachyzoite burden. Insets show cysts (upper left) or tachyzoites (lower left and right); IHC for T. gondii. Scale bars, 20 μm. g, Quantification of CNS parasite burden at 6 m.p.i. by qPCR. Data analysed by two-way ANOVA in c or two-sided unpaired Student’s t-test in e. Line graph depicts the mean ± s.e.m. Bar graphs depict the mean ± s.d. Source data
Fig. 5
Fig. 5. Δbfd1 infected mice die of tachyzoite replication despite a competent immune response.
a, Survival of C57BL/6J mice infected with WT (n = 40 mice) or Δbfd1 (n = 40 mice) parasites. A subset of surviving mice received sulfadiazine treatment beginning at 21 d.p.i. (WT, n = 12 mice; Δbfd1, n = 15 mice; treatment start indicated by vertical dashed line; data representative of 3 independent experiments). b, Representative photomicrographs of WT-infected or Δbfd1-infected cerebra at 30 d.p.i. Insets show T. gondii cysts in WT-infected brains and tachyzoites in Δbfd1-infected brains (H&E; scale bars, 20 μm). c, Semiquantitative scoring of necrosis severity in brain sections at 30 d.p.i. (WT, n = 3 mice; Δbfd1, n = 4 mice; *P = 0.0286). d, Brain leukocyte cellularity during chronic infection with WT (n = 3 or 4 mice per time point) or ∆bfd1 (n = 3 or 5 mice per time point) parasites, quantified by Guava ViaCount assay (*P = 0.0142, ****P = <0.0001; data representative of 2 independent experiments). eh, Flow cytometry analysis of the brains of naive mice (n = 4 mice) and mice at 30 d.p.i. with WT (n = 5 mice) or Δbfd1 (n = 3 mice) parasites (data representative of 3 independent experiments). e, UMAP and unsupervised x-shift clustering analysis of CNS CD45+ leukocytes at 30 d.p.i. f, Distribution of leukocytes among the 8 clusters shown in e (*P = 0.0001). g, Heat maps showing MFI of phenotypic markers with the highest expression in cluster 1. h, Quantification of inflammatory monocytes in the brain (CD45highCD11b+F4/80+Ly6Chi, cluster 1 shown in e; **P = 0.0085). Data analysed by two-sided Mann–Whitney test in c, two-way ANOVA in d, two-sided unpaired Student’s t-test with Bonferroni–Dunn correction for multiple comparisons in f and two-sided unpaired Student’s t-test in h. Bar graphs depict the mean ± s.d. Line graph depicts the mean ± s.e.m. Source data
Extended Data Fig. 1
Extended Data Fig. 1. Virulence and T cell responses during early stages of tub1-OVA and bag1-OVA infection.
a, Representative images of in vitro bag1-OVA tachyzoite- or cyst-infected HFFs, and in vivo bag1-OVA tissue cysts in the brains of mice at 30 dpi. Samples were stained with DAPI nuclear stain and anti-OVA antibody. DAPI (blue); OVA (green). Scale bar = 10 μm. b-c, C57BL/6 J mice were infected with tub1-OVA (n = 7 mice) or bag1-OVA (n = 5 mice) parasites, and spleens were harvested and analyzed at 10 dpi. b, Frequency and number of T. gondii peptide and SIINFEKL tetramer+ CD4+ and CD8+ T cells (***p = 0002.) c, Quantification of parasite burden by qPCR. d, Gating strategy for identifying OT-I T cells by flow cytometry. Cells were pre-gated on single cells. e, Experimental design for f-g. Naive CD45.1+CD45.2+ Nur77GFP OT-I T cells were transferred 1 day prior to infection with tub1-OVA or bag1-OVA parasites. Spleens and brains were harvested from infected mice and analyzed by flow cytometry during acute (n = 3 mice/group) and chronic (tub1-OVA, n = 5 mice; bag1-OVA, n = 3 mice) infection. f, Frequency and number of OT-I T cells (spleen: ****p = 0.000036, ***p = 0.000535; brain: **p = 0.001260, ***p = 0.000411.) g, Frequency and gMFI of Nur77GFP expression in brain OT-I T cells during chronic infection (tub1-OVA, n = 5 mice; bag1-OVA, n = 3 mice.) Data are representative of 2 independent experiments. Data analyzed by two-sided unpaired Student’s t-test; ns p > 0.05. Bar graphs depict the mean ± SD. Source data
Extended Data Fig. 2
Extended Data Fig. 2. Similar T. gondii specific T cell responses are induced in the brains of WT and Stat1ΔNEU mice at 3 months post-infection.
Brains from C57BL/6 J (WT) and Stat1ΔNEU mice infected with T. gondii were harvested at 3 mpi (n = 3 mice/group.) T. gondii-specific T cells were quantified and phenotyping was performed by flow cytometry. a, Frequency and number of T. gondii tetramer+ CD8+ T cells. b, UMAP and X-shift unsupervised clustering analysis of tetramer+ T cells. Colors represent 12 individual clusters. c, Distribution of tetramer+ T cells across the clusters identified in b. d-f, Phenotyping of tetramer+ CD8+ T cells by flow cytometry. Data are representative of 2 independent experiments. Data analyzed by two-sided unpaired Student’s t-test; Bonferroni-Dunn correction for multiple comparisons was included in statistical analyses performed in c and d; ns p > 0.05. Bar graphs depict the mean ± SD. Source data
Extended Data Fig. 3
Extended Data Fig. 3. WT and Δbfd1 parasites induce comparable immune responses during acute infection.
a-b, C57BL/6 J mice were infected with tdTomato+ WT (n = 4 mice) or Δbfd1 (n = 5 mice) parasites, and spleens were harvested and analyzed at 14 dpi. Naive CD45.1+CD45.2+ OT-I T cells were transferred one day prior to infection. a, Quantification of T. gondii-infected cells in the spleen by flow cytometry b, Splenic OT-I T cell frequency and numbers. c, Quantification of serum IFN-γ levels during WT (n = 4 mice) or Δbfd1 (n = 5 mice) infection. d, Representative images of T. gondii in the brains of mice 25 dpi with WT or Δbfd1 parasites. Brain sections were stained with DBA and either anti-SAG1 antibody (top row) or anti-SRS9 antibody (bottom row). SAG1 or SRS9 (red); tdTomato (green); DBA (purple). Scale bar = 10 μm. Data are representative of 2 independent experiments. Data analyzed by two-sided unpaired Student’s t-test; ns p > 0.05. Bar graphs depict the mean ± SD. Source data
Extended Data Fig. 4
Extended Data Fig. 4. Immune responses and pathology in the brain during chronic WT and Δbfd1 infection.
Brains were harvested from C57BL/6 J naïve mice and mice 30 dpi with WT or Δbfd1 parasites and analyzed as described. a, Detailed semiquantitative pathological scoring of brain histology sections. b, Cumulative pathology score based on the parameters shown in a (WT, n = 3 mice; Δbfd1, n = 4 mice.) c,d, Flow cytometry analysis of brains from naïve mice (n = 4 mice) and mice at 30 dpi with WT (n = 5 mice) or Δbfd1 (n = 3 mice) parasites (**p = 0.0093, *p = 0.0349, ****p = <0.0001; Data representative of 3 independent experiments). c, Quantification of CNS immune populations. d, Heatmaps displaying MFI of phenotypic markers used to identify UMAP clusters in Fig. 5e,f. e-g, Naive CD45.1+CD45.2+ OT-I T cells were transferred i.v. into mice 1 day prior to infection with WT (n = 3 mice) or Δbfd1 (n = 4 mice) parasites. Brains were harvested and analyzed by flow cytometry (Data representative of 2 independent experiments.) e, UMAP analysis of OT-I T cells at 14 and 30 dpi. f, Frequency of CD69+CD103+ OT-I T cells at 30 dpi (**p = 0.0053.) g, KLRG1 and CX3CR1 expression on OT-I T cells at 30 dpi (*p = 0.016035.). Data analyzed by two-sided Mann-Whitney test (b) or two-sided unpaired Student’s t-test (c,f,g); Bonferroni-Dunn correction for multiple comparisons was included in g; ns p > 0.05. Bar graphs depict the mean ± SD. Source data
Extended Data Fig. 5
Extended Data Fig. 5. CNS inflammation and pathology associated with Δbfd1 infection across mouse and parasite strains.
a-f, BALB/c mice were infected with WT or Δbfd1 parasites. Brains were harvested and analyzed at 30 dpi. a, Survival of mice until time of harvest. b, Quantification of CNS immune cell populations measured by flow cytometry (in order of appearance: **p = 0.0020, **p = 0.0013, **p = 0.0039, **p = 0.0010, *p = 0.0299.) Gating scheme to identify CNS immune populations is depicted in Supplementary Fig. 6. c,d, Cumulative pathology score (c) and detailed pathological assessment (d) of brain histology sections. Assessment was performed by a board-certified veterinary pathologist. e, Representative photomicrographs of the brain showing the parenchyma (top) and meninges (bottom) in the cerebrum at 30 dpi. Inset and black arrow show tachyzoites in the brain during Δbfd1 infection. f, Quantification of CNS parasite burden by qPCR. Data are representative of 1 experiment with n = 5 mice/group. Data analyzed by two-sided unpaired Student’s t-test (b,f) or two-sided Mann-Whitney test (c); ns p > 0.05. Bar graphs depict the mean ± SD. Source data

References

    1. Munz, C. Latency and lytic replication in Epstein–Barr virus-associated oncogenesis. Nat. Rev. Microbiol.17, 691–700 (2019). - PubMed
    1. Singh, N. & Tscharke, D. C. Herpes simplex virus latency is noisier the closer we look. J. Virol.9410.1128/JVI.01701-19 (2020). - PMC - PubMed
    1. Alanio, A. Dormancy in Cryptococcus neoformans: 60 years of accumulating evidence. J. Clin. Invest.130, 3353–3360 (2020). - PMC - PubMed
    1. Zhao, X. Y. & Ewald, S. E. The molecular biology and immune control of chronic Toxoplasma gondii infection. J. Clin. Invest.130, 3370–3380 (2020). - PMC - PubMed
    1. Goodrum, F. Human cytomegalovirus latency: approaching the Gordian knot. Annu. Rev. Virol.3, 333–357 (2016). - PMC - PubMed

MeSH terms

Substances