. 2025 May;17(5):909-922.
doi: 10.1038/s44321-025-00203-9. Epub 2025 Mar 27.

Soluble CD27 differentially predicts resistance to anti-PD1 alone but not with anti-CTLA-4 in melanoma

Affiliations

Soluble CD27 differentially predicts resistance to anti-PD1 alone but not with anti-CTLA-4 in melanoma

Ikuan Sam et al. EMBO Mol Med. 2025 May.

Abstract

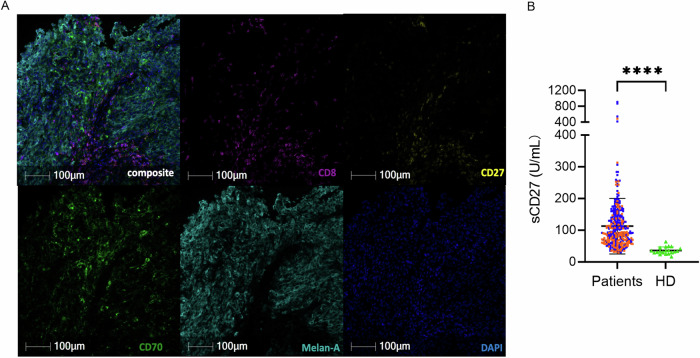
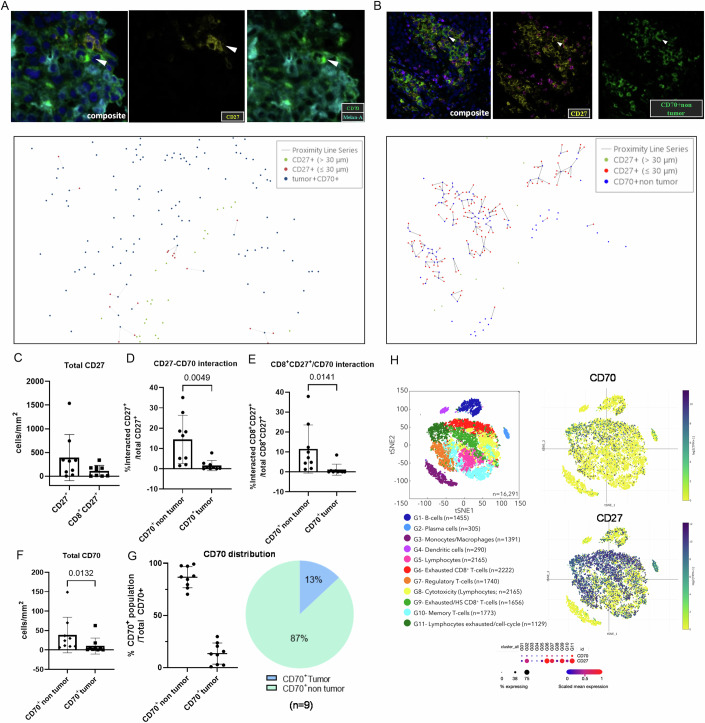
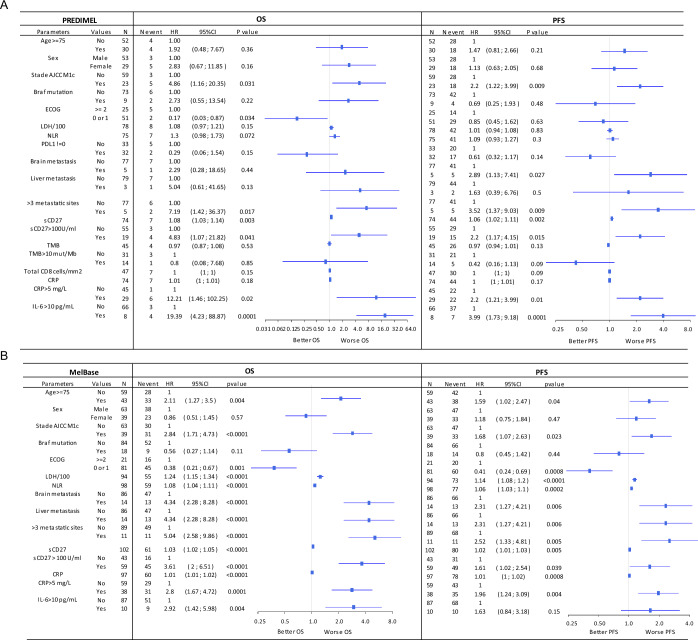
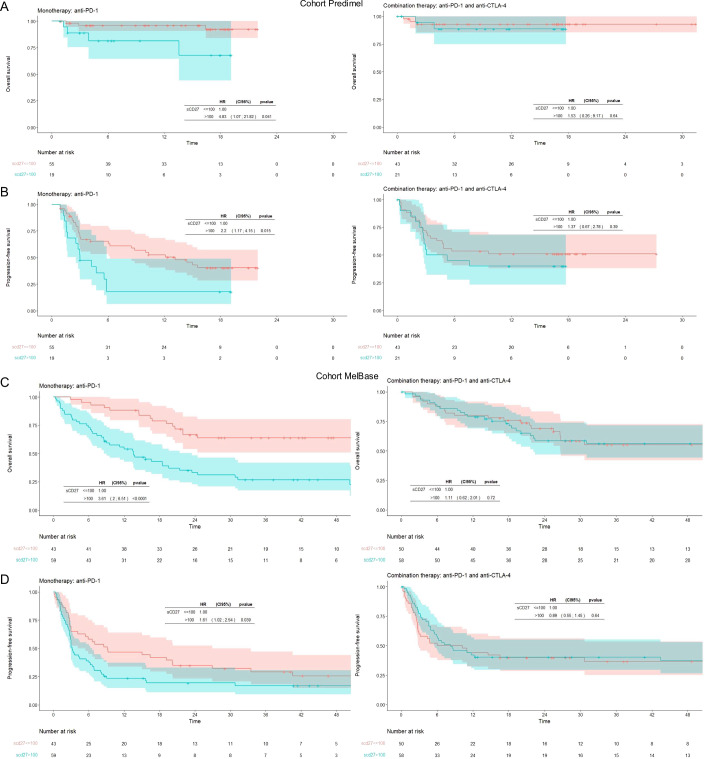
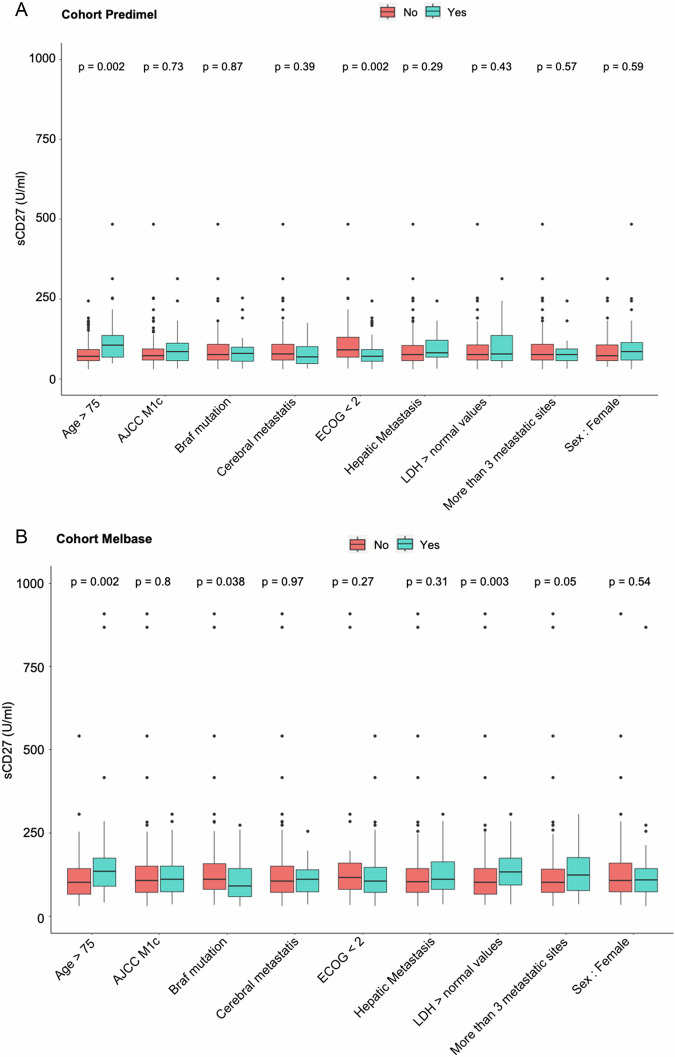
Metastatic melanoma can be treated with anti-PD-1 monotherapy or in combination with anti-CTLA-4 or anti-Lag3. However, combination therapy is associated with a high risk of toxicity. Recently, we reported that high plasma soluble CD27 (sCD27) levels reflect the intratumoral interaction of CD70-CD27 and dysfunctional T cells in the tumor microenvironment of renal cell carcinoma. In this study, we first characterized the intratumoral expression of CD70 and CD27 in melanoma tumors and their interaction in vivo. We then reported a significant association between baseline sCD27 and anti-PD-1 resistance as assessed by progression-free survival, overall survival, or 12-month complete response in two prospective cohorts of melanoma patients. Multivariate analysis confirmed that sCD27 was independently associated with clinical outcomes. Notably, sCD27 did not predict clinical response to combination therapy in either cohort. This differential predictive value of sCD27 for the two therapeutic options was later confirmed by propensity score analysis. Our results suggest that high plasma sCD27 levels predict poorer efficacy of anti-PD1 monotherapy in metastatic melanoma, justifying therapeutic escalation with a combination of anti-PD1 and anti-CTLA-4.

Keywords: CD70-CD27 Interaction; Immunotherapy; Melanoma; Predictive Biomarker; Tumor Microenvironment.


Conflict of interest statement

Disclosure and competing interests statement. Celeste Lebbe: Consulting fees: BMS, Pierre Fabre, Sanofi, Novartis, MSD, Amgen, Merck, Serono, Roche, Inflax. Payment of honoraria for lectures, présentations, speakers bureaux: Amgen, BMS, Pierre Fabre, Sanofi, Novartis, MSD, Incyte, Pfizer, Roche. Support for attending meeting and or travel: BMS, MSD, Novartis, Pierre Fabre, Roche, Sanofi. Participation on a data safety monitoring board or advisory board: BMS, Pierre Fabre, Sanofi, Novartis, MSD, Amgen, Merck Serono, Roche, Inflax. Research funding institution: BMS, Roche. Eric Tartour: Research contract: Servier, Oseo Pharma, Imcheck Therapeutics. Payment of honoraria for lectures, présentations, speakers bureaux: Sanofi, BMS, Merck-MSD, Olimpe. Participation of Advisory Board: BMS, Astra-Zeneca, Moderna, Amgen.

Figures

Figure 1
Figure 1. Melanoma patients express CD70 in their tumors and show an increase in plasma soluble CD27 levels.
(A) Representative image of multiplex immunostaining performed on formalin-fixed, paraffin-embedded melanoma tissues showing expression of CD8 (purple), CD27 (yellow), CD70 (green), Melan-A (tumor; Cyan). DAPI (blue) was included for cell segmentation. Cell phenotyping was performed using the HALO software, and isotype control antibodies were included in each experiment. (B) Baseline plasma concentrations of sCD27 (U/mL) in metastatic melanoma patients from the PREDIMEL cohort (n = 138, orange) and the MelBase cohort (n = 210, blue), along with age-matched healthy donors (n = 20) as controls. Data are presented in mean ± SD. P values were calculated by using the two-tailed Mann–Whitney test. ****P < 0.0001. Source data are available online for this figure.
Figure 2
Figure 2. CD27 interacts with CD70 expressed by tumor and non-tumor cells in the tumor microenvironment of melanoma patients.
Representative image showing the interaction of CD27-expressing cells with CD70 expressing tumor cells (CD70+Melan-A+) (A, upper) and non-tumor cells (CD70+Melan-A-) (B, upper). Spatial analysis was realized by measuring distance between CD27+ cells and CD70+ tumor cells (A, lower) and CD70+ non-tumor cells (B, lower). Green dots represented CD27+ cells out of 30 μm of CD70+ cells. Red dots represented CD27+ cells within 30 μm of CD70+ cells. Blue dots represented CD70 positive cells. (C) Density of total CD27+ cells and CD8+CD27+ cells in melanoma (n = 9). (D) Percentage of interacted CD27+ with CD70+ non-tumor or tumor cells among total CD27+cells (n = 9). (E) Percentage of interacted CD8+CD27+ with CD70+non-tumor cells or tumor cells among total CD8+CD27+ cell number (n = 9). Density (F) and average distribution (G) of CD70 expression in tumor cells (Melan-A+) and non-tumor cells (Melan-A-) in melanoma (n = 9). (H) Distribution of CD27 and CD70 gene expression in different cell cluster identified by public scRNAseq data analysis in melanoma (GSE120575, Sade-Feldman et al, 2018). tSNE plot of clustered CD45+ immune cells from melanoma tumors after sample normalization and integration in melanoma (left). The normalized log-scale count of CD70 (upper right) and CD27 (lower right) gene expression in the various clusters. Heat map (lower middle) of mean and percentage of CD27 and CD70 expression in each cluster. The data are shown as dots with mean ± standard error of the mean (SEM). Significance was determined by paired t test. Values of P < 0.05 were considered statistically significant. White arrows correspond to the interaction between cells expressing CD27 or CD70. Source data are available online for this figure.
Figure 3
Figure 3. Clinical and biological variables in the prediction of overall survival (OS) and progression-free survival (PFS) in melanoma patients treated by anti-PD-1 alone in both cohorts.
Forest plot displaying the univariate Cox’s model Hazard Ratios (HRs, blue squares) for OS (A left, B left) and PFS (A right, B right) and 95% confidence intervals (CI, solid horizontal blue segments) of baseline clinical and biological variables in the PREDIMEL cohort (A) and the MelBase cohort (B). Concentration of sCD27 was evaluated either as a continuous variable or dichotomized using a 100 U/ml cut-off. A two-sided p < 0.05 was considered significant. N indicates the number of patients in the subgroup defined by the characteristics (e.g., 59 patients aged <75) and N event indicates for each subgroup the number of events among them. The dots and solid lines represent HR and 95% CI. Source data are available online for this figure.
Figure 4
Figure 4. Concentrations of sCD27 differentially predict overall survival (OS) and progression-free survival (PFS) in two cohorts of metastatic melanoma patients treated with nivolumab or in combination with ipilimumab.
Metastatic melanoma patients from two cohorts, PREDIMEL (A, B) and MelBase (C, D), treated with either anti-PD-1 (AD Left) or a combination of anti-PD-1 and anti-CTLA-4 (AD Right). Kaplan-Meier curves for OS (A, C) or PFS (B, D) stratified on high (>100 U/ml) versus low (≤100 U/ml) concentrations of sCD27. Cox’s Model Hazards Ratio (HR), 95% confidence intervals, and Wald test p-value are presented. Source data are available online for this figure.
Figure 5
Figure 5. Association between clinical and biological parameters and sCD27 concentrations.
Boxplot depicts sCD27 concentrations according to clinical and biological variables in the PREDIMEL cohort (n = 139) (A) and in the MelBase cohort (n = 210) (B). A probability value of p < 0.05 (Wilcoxon rank sum test) was considered significant. For boxplots, solid black segments represent median values, lower and upper hinges correspond to the first and third quartiles, whiskers extremities extend to the most extreme data point no further than 1.5 times the interquartile range (length of the box) away from the box, and dots correspond to outliers with minima and maxima being the extreme dots. Missing data: PREDIMEL cohort: ECOG n = 17, n = 11 for LDH; MELBASE cohort: n = 1 for BRAF mutation, n = 4 for cerebral metastasis, n = 4 for liver metastasis, n = 17 for LDH, n = 4 for numbers of metastatic sites. Source data are available online for this figure.

References

    1. Altman DG, Lausen B, Sauerbrei W, Schumacher M (1994) Dangers of using “optimal” cutpoints in the evaluation of prognostic factors. J Natl Cancer Inst 86:829–835 - PubMed
    1. Amaria RN, Reddy SM, Tawbi HA, Davies MA, Ross MI, Glitza IC, Cormier JN, Lewis C, Hwu WJ, Hanna E et al (2018) Neoadjuvant immune checkpoint blockade in high-risk resectable melanoma. Nat Med 24:1649–1654 - PMC - PubMed
    1. Asrir A, Tardiveau C, Coudert J, Laffont R, Blanchard L, Bellard E, Veerman K, Bettini S, Lafouresse F, Vina E et al (2022) Tumor-associated high endothelial venules mediate lymphocyte entry into tumors and predict response to PD-1 plus CTLA-4 combination immunotherapy. Cancer Cell 40:318–334 - PubMed
    1. Auslander N, Zhang G, Lee JS, Frederick DT, Miao B, Moll T, Tian T, Wei Z, Madan S, Sullivan RJ et al (2018) Robust prediction of response to immune checkpoint blockade therapy in metastatic melanoma. Nat Med 24:1545–1549 - PMC - PubMed
    1. Bender R, Lange S (2001) Adjusting for multiple testing-when and how? J Clin Epidemiol 54:343–349 - PubMed

MeSH terms

Substances