

Distinct 5-methylcytosine profiles of LncRNA in breast cancer brain metastasis
- PMID: 40148799
- PMCID: PMC11951547
- DOI: 10.1186/s12885-025-13948-w
Distinct 5-methylcytosine profiles of LncRNA in breast cancer brain metastasis
Erratum in
-
Correction: Distinct 5-methylcytosine profiles of LncRNA in breast cancer brain metastasis.BMC Cancer. 2025 Apr 7;25(1):625. doi: 10.1186/s12885-025-14042-x. BMC Cancer. 2025. PMID: 40197157 Free PMC article. No abstract available.
Abstract
Background: Recent studies have identified a complex relationship between methylation patterns and the development of various cancers. Breast cancer (BC) is the second leading cause of cancer mortality among women. Approximately 5-20% of BC patients are at risk of BC brain metastases (BCBM). Although 5-methylcytosine (m5C) has been identified as an important regulatory modifier, its distribution in BCBM is not well understood. This study aimed to investigate the distribution of m5C in BCBM.
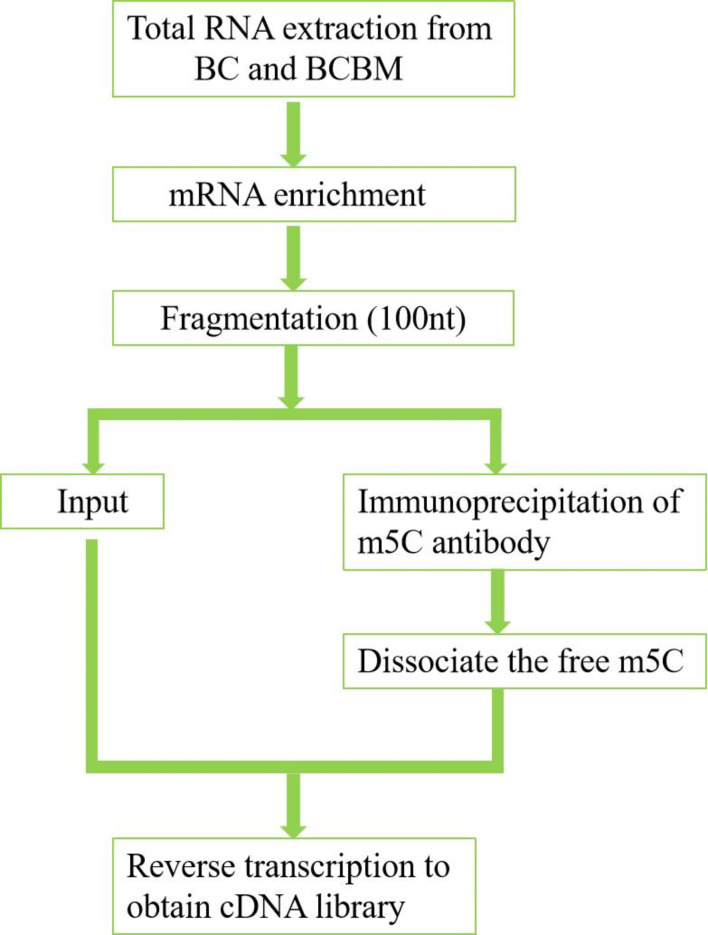
Materials and methods: Samples from BCBM (231-BR cells) and BC (MDA-MB-231 cells) groups were subjected to a comprehensive analysis of the m5C methylation in long non-coding RNA (lncRNA) using methylated RNA immunoprecipitation next-generation sequencing (MeRIP-seq). The expression levels of methylated genes in BC and adjacent tissues were verified through quantitative real-time polymerase chain reaction (RT-qPCR). Enrichment pathway analyses were through Gene Ontology (GO) and the Kyoto Encyclopedia of Genes and Genomes (KEGG) to predict the potential functions of m5C in BCBM.
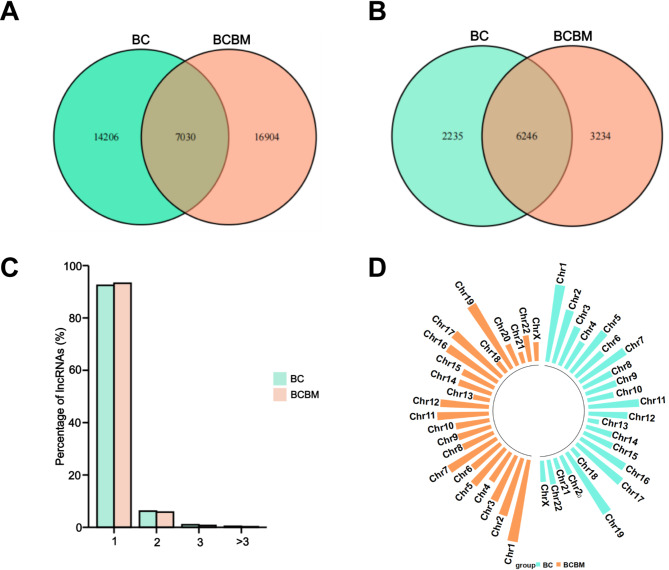
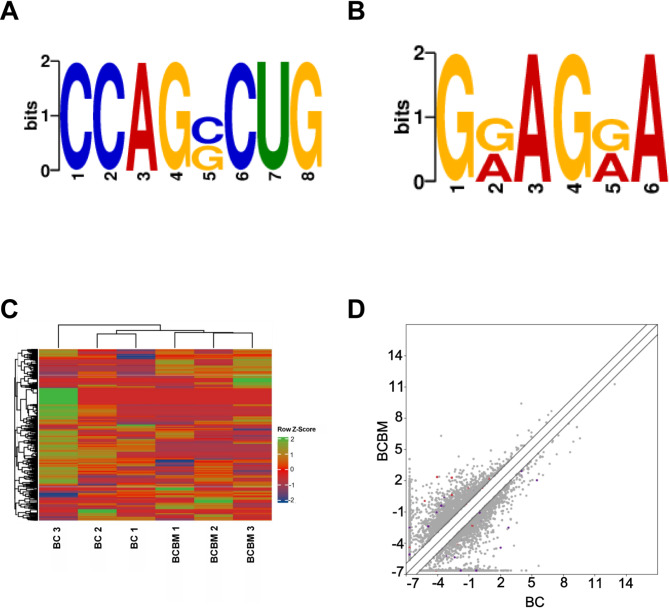
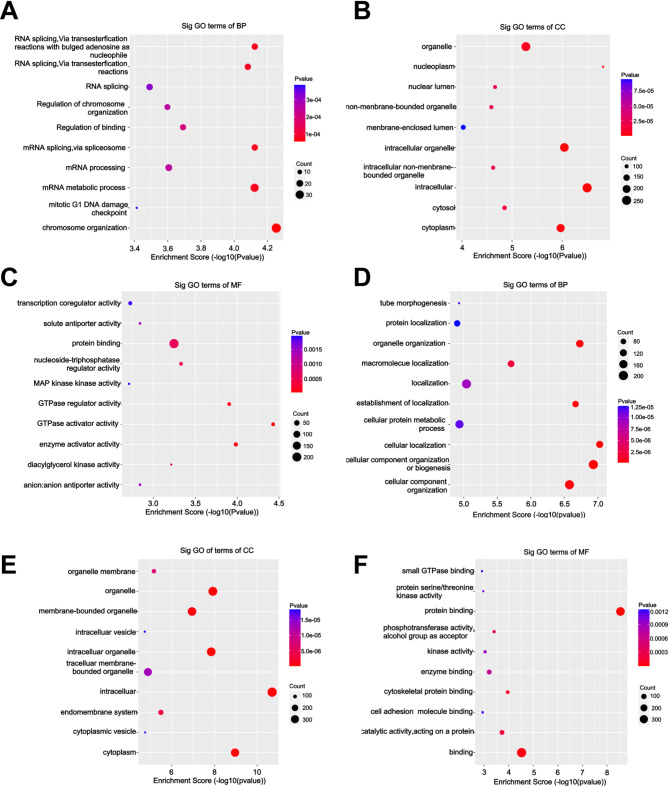
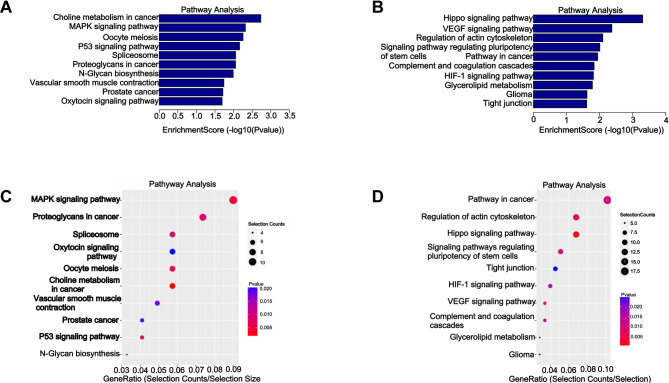
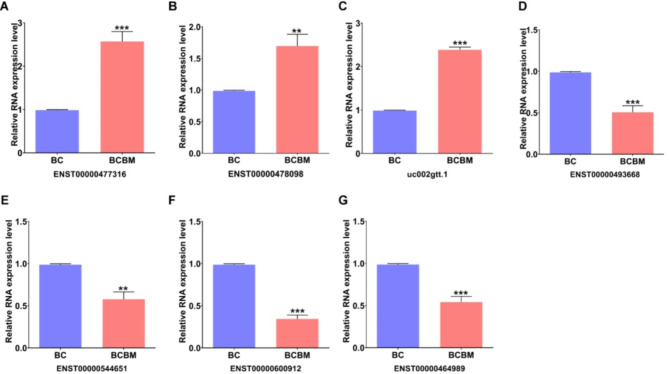
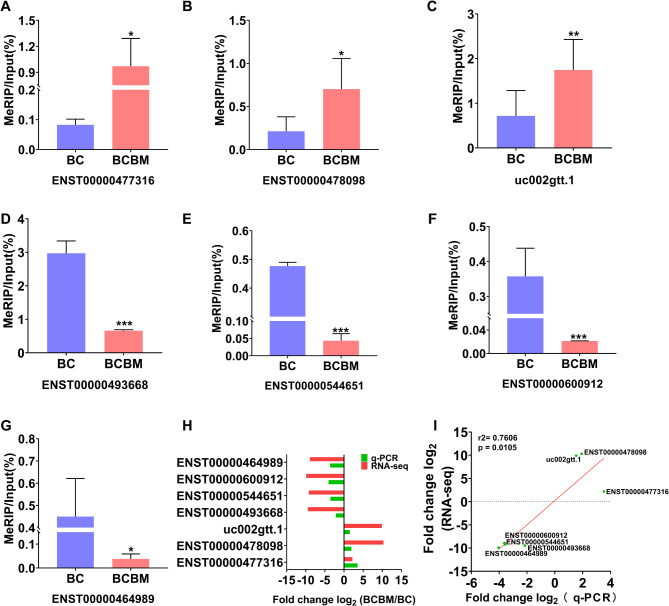
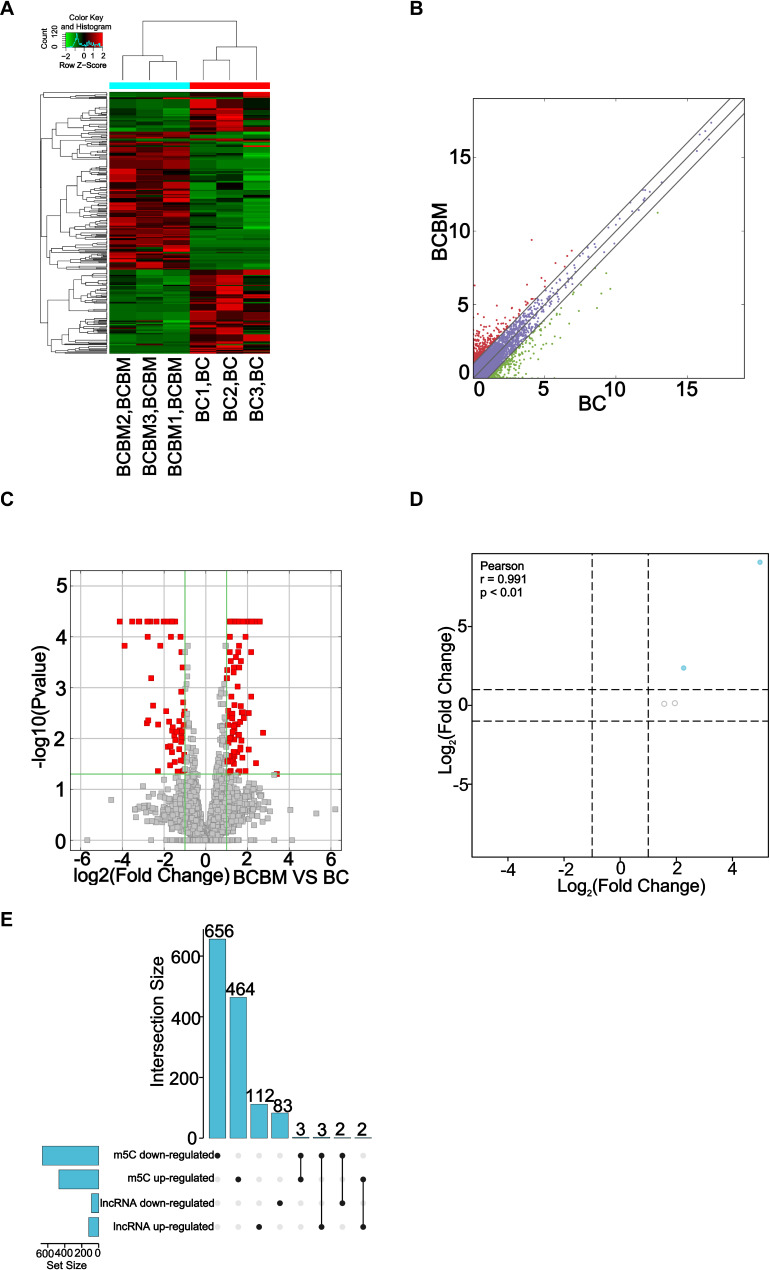
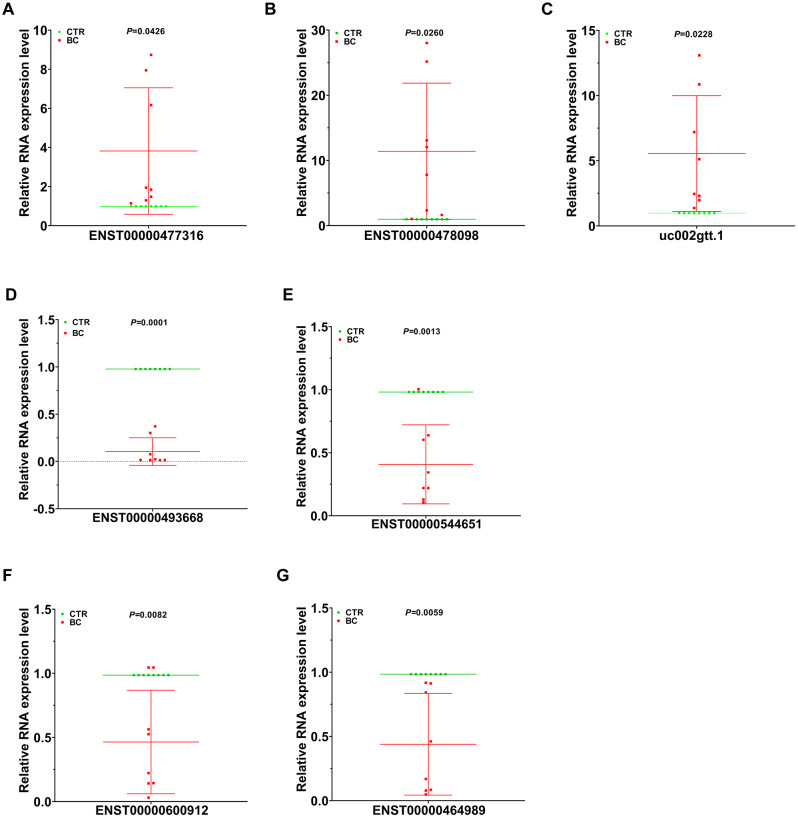
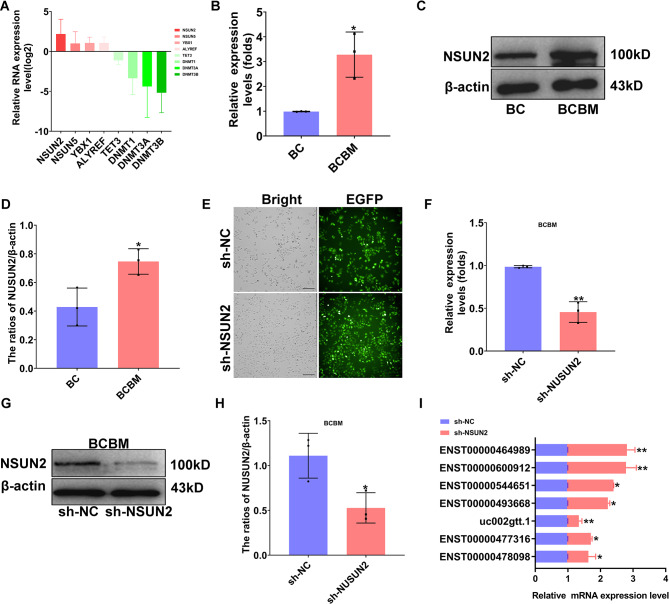
Results: The MeRIP-seq analysis identified 23,934 m5C peaks in BCBM and 21,236 m5C in BC. A total of 9,480 annotated genes (BCBM) and 8,481 annotated genes (BC) were mapped. Notably, 1,819 methylation sites in lncRNA were upregulated in BCBM, whereas 2,415 methylation sites were upregulated in BC. Significant m5C hypermethylated lncRNAs included ENST00000477316, ENST00000478098 and uc002gtt.1, whereas hypomethylated lncRNAs included ENST00000600912, ENST00000493668, ENST00000544651 and ENST00000464989. These results were verified by qPCR and MeRIP-qPCR in BC and BCBM. Considering the strong association between m5C RNA methylation regulators and lncRNA, we examined the expression levels of 13 m5C RNA methylation regulators and observed significant differences between BC tissues and adjacent normal tissues. In addition, the interaction between regulators of altered expression and the differentially expressed genes in vitro was analyzed. The GO and KEGG pathways analyses revealed that genes significantly associated with m5C sites in lncRNA were linked to the BCBM signaling pathways.
Conclusion: This uncovered significant variations in the levels and distribution of m5C in BCBM compared to BC. The findings provide a new theoretical understanding of the mechanisms of BCBM.
Keywords: 5-methylcytosine (m5C); Breast Cancer Brain Metastases (BCBM); Gene Ontology (GO) and Kyoto Encyclopedia of Genes and Genomes (KEGG); Long non-coding RNA (lncRNA); Methylated RNA Immunoprecipitation next-generation sequencing (MeRIP-seq); Methylation regulators.
© 2025. The Author(s).
Conflict of interest statement
Declarations. Ethics approval and consent to participate: All human samples studies have been approved by the Ethics Committee of Liaocheng People’s Hospital (2022261), and all participants have signed informed consent forms. Consent to for publication: All authors have read, approved, and agreed to publish this manuscript. Competing interests: The authors declare no competing interests.
Figures
References
-
- Delaunay S, Frye M. RNA modifications regulating cell fate in cancer. Nat Cell Biol. 2019;21(5):552–9. - PubMed
-
- Chen X, Li A, Sun BF, Yang Y, Han YN, Yuan X, Chen RX, Wei WS, Liu Y, Gao CC, et al. 5-methylcytosine promotes pathogenesis of bladder cancer through stabilizing mRNAs. Nat Cell Biol. 2019;21(8):978–90. - PubMed
MeSH terms
Substances
Grants and funding
- 202203020733/Medicine and Health Science and Technology Foundation of Shandong Province
- 202202080721/Medicine and Health Science and Technology Foundation of Shandong Province
- 202111000399/Medicine and Health Science and Technology Foundation of Shandong Province
- 2022YDSF35/Liaocheng Key R&D Project
- 2022YDSF31/Liaocheng Key R&D Project
LinkOut - more resources
Full Text Sources
Medical
Miscellaneous
