. 2025 Mar 28;20(1):38.
doi: 10.1186/s13024-025-00826-z.

A stress-dependent TDP-43 SUMOylation program preserves neuronal function

Affiliations

A stress-dependent TDP-43 SUMOylation program preserves neuronal function

Terry R Suk et al. Mol Neurodegener. .

Abstract

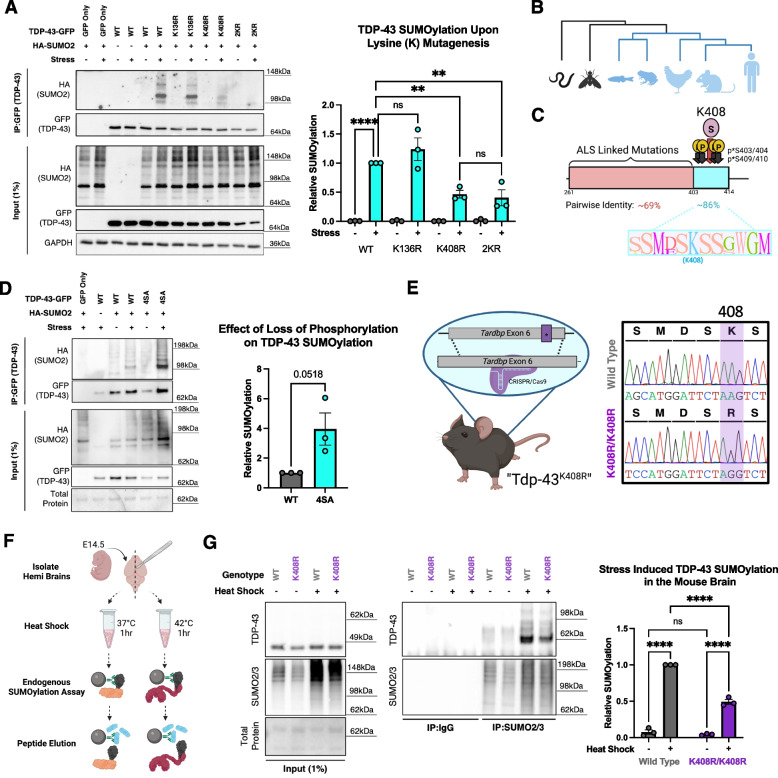
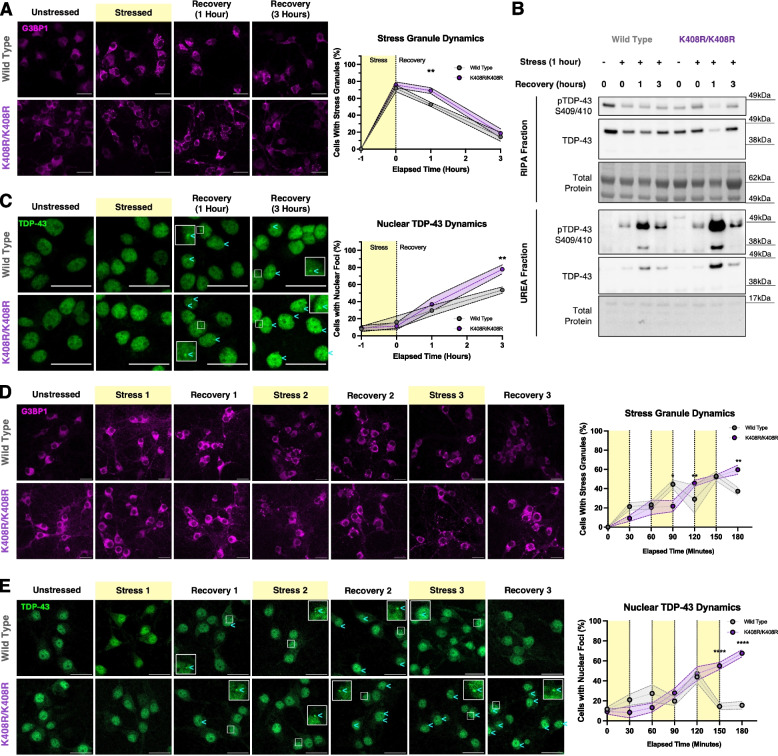
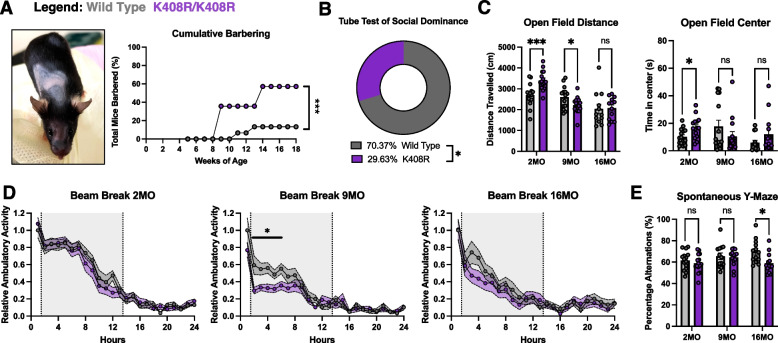
Amyotrophic Lateral Sclerosis (ALS) and Frontotemporal Dementia (FTD) are overwhelmingly linked to TDP-43 dysfunction. Mutations in TDP-43 are rare, indicating that the progressive accumulation of exogenous factors - such as cellular stressors - converge on TDP-43 to play a key role in disease pathogenesis. Post translational modifications such as SUMOylation play essential roles in response to such exogenous stressors. We therefore set out to understand how SUMOylation may regulate TDP-43 in health and disease. We find that TDP-43 is regulated dynamically via SUMOylation in response to cellular stressors. When this process is blocked in vivo, we note age-dependent TDP-43 pathology and sex-specific behavioral deficits linking TDP-43 SUMOylation with aging and disease. We further find that SUMOylation is correlated with human aging and disease states. Collectively, this work presents TDP-43 SUMOylation as an early physiological response to cellular stress, disruption of which may confer a risk for TDP-43 proteinopathy.

Keywords: ALS; FTD; Mouse Model; Pathology; Post Translational Modifications; SUMOylation; Stress; TDP-43.


Conflict of interest statement

Declarations. Competing interests: Authors declare that they have no competing interests.

Figures

Fig. 1
Fig. 1
SUMOylation dynamically regulates nuclear TDP-43 in a stress-responsive manner. A Schematic of immunoprecipitation assays to detect TDP-43 SUMOylation. B Representative SUMOylation Assay western blot in HEK293T cells detecting TDP-43 SUMOylation specifically in response to 1 h sodium arsenite (250 µM) stress. * = SUMOylated TDP-43, ** = PolySUMOylated TDP-43. C Schematic of TDP-43-GFP Nuclear Localization Sequence (NLS) variants and representative florescent microscopy analysis of their subcellular localization. (Scale bar = 10 µm). Yellow amino acids represent those critical for PY-NLS function. Teal arginine residue was mutated from the native HNRNPA1. D Representative GFP-trap SUMOylation assay in HEK293T cells detecting loss of SUMOylation in response to TDP-43 mislocalization in response to 1 h sodium arsenite stress (250 µM). (N = 3) RM One-Way ANOVA with Fisher’s LSD test. Data presented as mean ± SEM relative to stressed TDP-43-GFP (WT) condition, * p < 0.05, ** p < 0.005, *** p < 0.0005. Grey bar = Unstressed, Cyan bar = Stressed. E Representative image and quantification of relative proximity ligation signal between TDP-43 and SUMO2/3 in murine primary cortical neuron cultures (7 DIV) in response to 1 h sodium arsenite (250 µM) treatment. Scale bar = 20 μm. (N = 4 per condition) Unpaired T-test data presented as mean ± SEM, *** p < 0.0005 F Representative SUMOylation Assay in HEK293T cells of TDP-43 SUMOylation dynamics during stress (250 µM sodium arsenite) and recovery demonstrating a dependency on the ubiquitin proteosome for clearance of polySUMOylated TDP-43 by treatment with proteasome inhibitor MG132 (2 µM). (N = 3) RM One-Way ANOVA with Fisher’s LSD test. Data presented as mean ± SEM relative to 1 h stressed condition, * p < 0.05, ** p < 0.005, *** p < 0.0005, **** p < 0.0001. Grey Bar = Unstressed, Cyan Bar = Stressed, Yellow Bar = Post stress recovery, Red Bar = MG132 inhibitor added. G Schematic and representative GFP-Trap SUMOylation assay in HEK293T cells screening for potential E3 ligases regulating TDP-43 SUMOylation in response to 1 h sodium arsenite stress (250 µM). (N = 3) RM One-Way ANOVA with Fisher’s LSD test. Data presented as mean ± SEM relative to stressed control without sgRNA, *** p < 0.0005, **** p < 0.0001. Light Grey Bar = Control or insignificant change from stressed condition, Dark Grey Bar = Positive control, Cyan Bar = Significantly different than stressed condition
Fig. 2
Fig. 2
TDP-43 is SUMOylated at K408 in a conserved region of the C-terminal domain. A Representative GFP-Trap SUMOylation assay in HEK293T cells to map the site of TDP-43 SUMOylation in response to 1 h sodium arsenite (250 μM) stress. One-Way ANOVA with Fisher’s LSD test. Data presented as mean ± SEM relative to stressed TDP-43-GFP (WT) condition, ** p < 0.005, **** p < 0.0001. Grey Bar = Unstressed, Cyan Bar = Stressed. B Phylogenetic representation from alignment of representative TDP-43 paralogs highlighting the emergence and conservation of [human] K408 (Blue). C Pairwise identity of the [human] TDP-43 C-terminal domain from MUSCLE alignment of 300 amino acid sequences for TDP-43 paralogs from Humans to Actinopterygii from OrthoDB. Red represents the TDP-43 C-terminal domain (Intrinsically disordered domain). Cyan represents PTM- enriched region at the extreme C-terminus. D Representative GFP-Trap SUMOylation assay in HEK293T cells with phospho-dead TDP-43 “4SA” (S403/404/409/410A) highlighting antagonism between SUMOylation and phosphorylation. (N = 3) Unpaired T-test data presented as mean ± SEM. E Schematic and sanger sequencing of the TDP-43K408R knock in mouse line. F Schematic of endogenous SUMOylation assay from embryonic mouse brains. G Validation of loss of stress-induced TDP-43 SUMOylation in the brains of embryonic TDP-43K408R mice ex vivo. All mice presented are either wild type (WT) or homozygous for K408R (K408R/K408R). 2-Way ANOVA with Fisher’s LSD test. Data presented as mean ± SEM relative to stressed WT condition, **** p < 0.0001
Fig. 3
Fig. 3
Blocking TDP-43 SUMOylation at K408 impairs the cellular stress response in neurons. A Representative images and quantification of G3BP1 stress granule dynamics in mouse primary cortical neurons (7 DIV) during stress (1 h 250 μM sodium arsenite) and recovery. G3BP1 contrast was set for optimal visualization of stress granules. Scale bar = 25 μm (N = 5), 2-Way ANOVA with Fisher’s LSD test data presented as mean ± SEM, * p < 0.05, ** p < 0.005. B Representative western blot and quantification of RIPA and UREA fractions from mouse primary cortical neurons (7 DIV) during stress (1 h 250 μM sodium arsenite) and recovery. Quantification found in Fig. S6A. C Representative images and quantification of TDP-43 nuclear foci formation in mouse primary cortical neurons (7 DIV) during stress (1 h 250 μM sodium arsenite) and recovery. Cyan arrowheads denote cells with nuclear TDP-43 foci. Scale bar = 25 μm. (N = 5), 2-Way ANOVA with Fisher’s LSD test data presented as mean ± SEM, ** p < 0.005. D Representative images and quantification of G3BP1 stress granule dynamics in mouse primary cortical neurons (7 DIV) during repeated stress (30-min 250 μM sodium arsenite treatment) and recovery (30-min washout), repeated 3 times. Scale bar = 25 μm. (N = 3), 2-Way ANOVA with Fisher’s LSD test data presented as mean ± SEM, * p < 0.05, ** p < 0.005. E Representative images and quantification of TDP-43 nuclear foci formation in mouse primary cortical neurons (7 DIV) during repeated stress (30-min 250 μM sodium arsenite treatment) and recovery (30-min washout), repeated 3 times. Cyan arrowheads denote cells with nuclear TDP-43 foci. Scale bar = 25 μm. (N = 3), 2-Way ANOVA with Fisher’s LSD test data presented as mean ± SEM, ****p < 0.0001. For all immunofluorescent assays at least 50 cells were imaged and quantified per replicate (N = 3–5). All assays present wild type mice in grey and K408R/K408R mice in purple
Fig. 4
Fig. 4
Blocking TDP-43 SUMOylation at K408 in vivo leads to sex-specific social and cognitive impairment in female mice. A Representative image of a barbered female mouse and quantification of cumulative barbering probability. 2-Way ANOVA with Tukey’s Multiple Comparisons, *** p < 0.0005. B Tube test of social dominance at 16 months of age (16MO) displaying the total head-to-head battles and win percentage by genotype comparing wild type against K408R (K408R/ + and K408R/K408R animals). Binomial Test of Observed vs. Expected with Expected due to random chance set to 50%, * p < 0.05. C Quantification of total distance traveled (cm) and total time in center (s) in the open field test of female mice. Mixed Effects Analysis with Tukey’s multiple comparison data presented as mean ± SEM, *** p < 0.0005, * p < 0.05. D Quantification of percent alternations in the spontaneous Y-maze test of female mice at 2, 9, and 16 months of age (2MO, 9MO, 16MO, respectively). Mixed-Effects Analysis with Tukey’s multiple comparison data presented as mean ± SEM, * p < 0.05. E Quantification of relative ambulatory activity normalized to wild type at 1 h of female mice at 2, 9, and 16 months of age (2MO, 9MO, and 16MO, respectively). Grey shading between hours 2 and 14 indicate “lights off” with respect to day/night light cycle. 2-Way ANOVA with Tukey’s multiple comparison data presented as mean ± SEM, * p < 0.05. All assays present wild type mice in grey and K408R/K408R mice in purple
Fig. 5
Fig. 5
Male TDP-43K408R mice present with age-specific features of ALS. A Representative images and quantification of TDP-43 mislocalization in the lumbar spinal cord of 9-month-old TDP-43K408R male and female mice. Each datapoint represents the average of 4 serial sections, 40 μm apart per individual mouse. Scale bar = 100 μm. (N = 4 per sex/genotype) Unpaired t-test, *** p < 0.0005. See Fig. S12C for sex comparisons. B Representative images at 16 months of age (16MO) and quantification (2MO, 9MO, and 16MO) of neuromuscular junction (NMJ) innervation in the tibialis anterior of male TDP-43K408R mice. > 80 NMJs were quantified per animal. Data presented as mean ± SEM. (N = 3–4 per genotype) 2-Way ANOVA with Tukey’s multiple comparison analysis, *p < 0.05, ****p < 0.0001. C Representative images and quantification of ChAT + motor neurons in the ventral horn of the lumbar spinal cord of male mice. Each datapoint is the average of 4 serial sections spaced 40 μm apart through the lumbar enlargement of the lumbar spinal cord. Unpaired t-test, ** p < 0.005. D Survival curve for male TDP-43K408R mice (Females found in Fig. S7D). Curve comparisons analyzed using Log-Rank test and Gehan-Breslow-Wilcoxon test. *p < 0.05. All assays present Wild Type mice in grey and K408R/K408R mice in purple
Fig. 6
Fig. 6
SUMOylation correlates with aging and is enriched in the prefrontal cortex of ALS/FTD patients. A Demographic composition of temporal lobe samples from aging cohort. B Representative western blot and box plot of SUMO2/3 across binned age groups. Average Age: “Young” = 6.32 yrs, N = 14; “Adult” = 31.11 yrs, N = 20; “Aged” = 64.00 yrs, N = 19. Kruskall-Wallis with Uncorrected Dunn’s multiple comparisons test. * p < 0.05, ** p < 0.005. C Representative images and quantification from proximity ligation assay (PLA) between SUMO2/3 and TDP-43 in the prefrontal cortex from 3 patients diagnosed with ALS/FTD and unaffected controls. (N = 7–8) Unpaired T-test. Data presented as mean PLA foci/per field of view ± SEM relative to average of unaffected controls, * p < 0.05

References

    1. Hipp MS, Kasturi P, Hartl FU. The proteostasis network and its decline in ageing. Nat Rev Mol Cell Biol. 2019;20(7):421–35. - PubMed
    1. Spires-Jones TL, Attems J, Thal DR. Interactions of pathological proteins in neurodegenerative diseases. Acta Neuropathol. 2017;134(2):187–205. - PMC - PubMed
    1. Hardiman O, Al-Chalabi A, Chio A, Corr EM, Logroscino G, Robberecht W, Shaw PJ, Simmons Z, Van Den Berg LH. Amyotrophic lateral sclerosis. Nat Rev Dis Primers. 2017;3(1):1–19. - PubMed
    1. Grossman M, Seeley WW, Boxer AL, et al. Frontotemporal lobar degeneration. Nat Rev Dis Primers. 2023;9(1):1–19. - PubMed
    1. Burrell JR, Halliday GM, Kril JJ, Ittner LM, Götz J, Kiernan MC, Hodges JR. The frontotemporal dementia-motor neuron disease continuum. Lancet. 2016;388:919–31. - PubMed

Grants and funding

LinkOut - more resources