. 2025 Mar 12;15(6):801.
doi: 10.3390/ani15060801.

Evaluating Past Range Shifts and Niche Dynamics of Giant Pandas Since the Last Interglacial

Affiliations

Evaluating Past Range Shifts and Niche Dynamics of Giant Pandas Since the Last Interglacial

Yadong Xu et al. Animals (Basel). .

Abstract

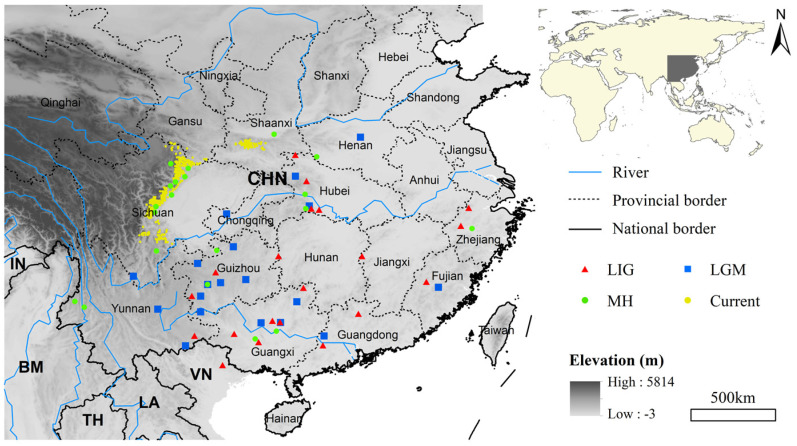
Understanding the response of species to past climate change provides great opportunities to know their adaptive capacity for resilience under future climate change. Since the Late Pleistocene, dramatic climate fluctuations have significantly impacted the distribution of giant pandas (Ailuropoda melanoleuca). However, how the spatial distribution and climatic niche of giant pandas shifted in response to past climate change remain poorly understood. Based on the known distribution records (fossil and present day) and the most updated climate projections for the Last Interglacial (LIG; ~120 ka), Last Glacial Maximum (LGM; ~22 ka), Mid-Holocene (MH; ~6 ka), and the present day, we predicted and compared the distribution and climatic niche of giant pandas. The results show that giant pandas have undergone a considerable range contraction (a 28.27% reduction) followed by a marked range expansion (a 75.8% increase) during the LIG-LGM-MH period, while its climatic niche remained relatively stable. However, from the MH to the current, both the distribution area and climatic niche of giant pandas have undergone significant changes. Our findings suggest that the giant panda may adjust its distribution to track stable climatic niches in response to future climate change. Future conservation planning should designate accessible areas for giant pandas and adjust priority conservation areas as needed.

Keywords: Ailuropoda melanoleuca; Paleo-climate change; WorldClim; climatic niche; ecological niche model; ecospat; range shift.


Conflict of interest statement

The authors declare no conflicts of interest.

Figures

Figure 1
Figure 1
Map of the study area with a digital elevation map in the background. Red triangles, blue squares, and green filled circles represent the fossil points used for modelling during the Last Interglacial (LIG), Last Glacial Maximum (LGM), and Mid-Holocene (MH), respectively. The yellow solid circles represent the occurrence records used for modelling in the current era.
Figure 2
Figure 2
The range of giant pandas during the Last Interglacial (a), the Last Glacial Maximum (b), the Mid-Holocene (c), and current period (d), and range shifts since the Last Interglacial (e). The direction and length of the arrows represent the direction and distance of shift. The green solid circles indicate undated giant panda fossils since the LIG.
Figure 3
Figure 3
Response curves of giant pandas to seven climate variables during the Last Interglacial (green), the Last Glacial Maximum (blue), the Mid-Holocene (red), and the current period (black). (a) Bio2, mean diurnal temperature range; (b) Bio3, Iiothermality; (c) Bio8, mean temperature of wettest quarter; (d) Bio9, mean temperature of driest quarter; (e) Bio15,precipitation seasonality), (f) Bio18, precipitation of warmest quarter; (g) Bio19, precipitation of coldest quarter.
Figure 4
Figure 4
Comparison of climatic niches of giant pandas during the Last Interglacial (LIG) and Last Glacial Maximum (LGM). (a) Each climatic variable is described in the correlation circle along the two PCA axes. (b) Giant pandas in the LIG (green) and LGM (red) climatic niches, with overlapping regions in purple. Red arrows connect the centroid of niches. The outer solid line represents the climatic conditions for each period (green: LIG; red: LGM), and the dashed line represents 50% of the climatic conditions in the study area for each period. Equivalence test (c) and similarity test (d) of climatic niches of giant pandas in LIG and LGM. The red line with a diamond indicates the observed niche overlap Schoener’s D, and the gray bar indicates the simulated niche overlap. ** indicates highly significant (p < 0.01).
Figure 5
Figure 5
Comparison of climatic niches of giant pandas during the Last Glacial Maximum (LGM) and Mid-Holocene (MH). (a) Each climatic variable is described in the correlation circle along the two PCA axes. (b) Giant pandas in the LGM (green) and MH (red) climatic niches, with overlapping regions in purple, showing that the LGM distribution (green) is entirely encompassed within the overlapping purple area. Red arrows connect the centroid of niches. The outer solid line represents the climatic conditions for each period (green: LGM; red: MH), and the dashed line represents 50% of the climatic conditions in the study area for each period. Equivalence test (c) and similarity test (d) of climatic niches of giant pandas in the LGM and MH. The red line with a diamond indicates the observed niche overlap Schoener’s D, and the gray bar indicates the simulated niche overlap. ** indicates highly significant (p < 0.01), and * indicates significant (p < 0.05).
Figure 6
Figure 6
Comparison of climatic niches of giant pandas during the Mid-Holocene (MH) and current period. (a) Each climatic variable is described in the correlation circle along the two PCA axes. (b) Giant pandas in the MH (green) and current (red) climatic niches, with overlapping regions in purple, showing that the current distribution (red) is entirely encompassed within the overlapping purple area. Red arrows connect the centroid of niches. The outer solid line represents the climatic conditions for each period (green: MH; red: current), and the dashed line represents 50% of the climatic conditions in the study area for each period. Equivalence test (c) and similarity test (d) of climatic niches of giant pandas in the MH and current period. The red line with a diamond indicates the observed niche overlap Schoener’s D, and the gray bar indicates the simulated niche overlap. The ns indicates not statistically significant.

References

    1. Holmes J., Lowe J., Wolff E., Srokosz M. Rapid climate change: Lessons from the recent geological past. Glob. Planet. Change. 2011;79:157–162. doi: 10.1016/j.gloplacha.2010.10.005. - DOI
    1. Bellard C., Bertelsmeier C., Leadley P., Thuiller W., Courchamp F. Impacts of climate change on the future of biodiversity. Ecol. Lett. 2012;15:365–377. doi: 10.1111/j.1461-0248.2011.01736.x. - DOI - PMC - PubMed
    1. Loarie S.R., Duffy P.B., Hamilton H., Asner G.P., Field C.B., Ackerly D.D. The velocity of climate change. Nature. 2009;462:1052–1055. doi: 10.1038/nature08649. - DOI - PubMed
    1. Parmesan C. Ecological and Evolutionary Responses to Recent Climate Change. Annu. Rev. Ecol. Evol. Syst. 2006;37:637–669. doi: 10.1146/annurev.ecolsys.37.091305.110100. - DOI
    1. Parmesan C., Yohe G. A globally coherent fingerprint of climate change impacts across natural systems. Nature. 2003;421:37–42. doi: 10.1038/nature01286. - DOI - PubMed

LinkOut - more resources