Review
. 2025 May;12(17):e2414674.
doi: 10.1002/advs.202414674. Epub 2025 Mar 27.

MXene-Supported Single-Atom Electrocatalysts

Affiliations
Review

MXene-Supported Single-Atom Electrocatalysts

Jianan He et al. Adv Sci (Weinh). 2025 May.

Abstract

MXenes, a novel member of the 2D material family, shows promising potential in stabilizing isolated atoms and maximizing the atom utilization efficiency for catalytic applications. This review focuses on the role of MXenes as support for single-atom catalysts (SACs) for various electrochemical reactions, namely the hydrogen evolution reaction (HER), oxygen evolution reaction (OER), oxygen reduction reaction (ORR), carbon dioxide reduction reaction (CO2RR), and nitrogen reduction reaction (NRR). First, state-of-the-art characterization and synthesis methods of MXenes and MXene-supported SACs are discussed, highlighting how the unique structure and tunable functional groups enhance the catalytic performance of pristine MXenes and contribute to stabilizing SAs. Then, recent studies of MXene-supported SACs in different electrocatalytic areas are examined, including experimental and theoretical studies. Finally, this review discusses the challenges and outlook of the utilization of MXene-supported SACs in the field of electrocatalysis.

Keywords: MXenes; catalytic applications; single‐atom catalysts; support; synthesis and characterization.


Conflict of interest statement

The authors declare no conflict of interest.

Figures

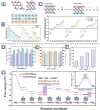
Figure 1
Figure 1
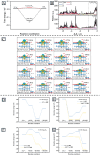
The periodic table shows elements involved in the formation of MAX phases and MXenes in previous publications. Light blue: M atoms; gray: A atoms; dark green: X atoms; purple: (T) elements; solid circles: SAs discussed in the present work with experiments; dotted circles: SAs discussed in the present work with theoretical calculations.
Figure 2
Figure 2
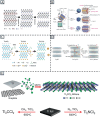
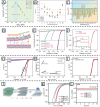
A) Schematic of the exfoliation process for Ti3AlC2 with HF. Reproduced with permission.[ 53 ] Copyright 2011, Wiley‐VCH. B) The reaction between Ti3AlC2 and aqueous NaOH solution under different conditions. Reproduced with permission.[ 60 ] Copyright 2018, Wiley‐VCH. C) Schematic of the etching process for Ti3AlC2 with molten salt. Reproduced with permission.[ 61 ] Copyright 2019, American Chemical Society. D) Schematic illustration of the etching of Ti2AlC toward vacancy‐enriched Ti2CClx MXene. Reproduced with permission.[ 62 ] Copyright 2024, Wiley‐VCH. E) Schematic diagram of the synthesis by bottom‐up method. Reproduced with permission.[ 65 ] Copyright 2023, The American Association for the Advancement of Science.
Figure 3
Figure 3
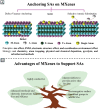
A) Three methods for anchoring single metal atoms on MXenes; B) The advantages of MXenes to support SAs.
Figure 4
Figure 4
A) HAADF–STEM image of Mo2TiC2Tx–PtSA. B) Magnified HAADF–STEM image of Mo2TiC2Tx–PtSA and its corresponding simulated image, and illustration of the structure of Mo2TiC2Tx–PtSA, showing the isolated Pt atoms (circled). C) STEM–EDS elemental mapping of Mo2TiC2Tx–PtSA nanosheets. Reproduced with permission.[ 79 ] Copyright 2018, Springer Nature. D) Atomic‐resolution HAADF‐STEM image of Ti2CClx MXene. E) Line intensity profiles obtained from the rectangular regions in (D), showed the existence of Ti vacancies. F) Atomic‐resolution HAADF‐STEM image of Zn–Ti2CClx. G) Line intensity profiles obtained from the rectangular regions in (F), showed the existence of single‐atom Zn. H) Atomic‐resolution HAADF‐STEM image, and I) the experimental and simulated HAADF‐STEM images of Ti2CClx–PtSA. Reproduced with permission.[ 62 ] Copyright 2024, Wiley‐VCH. J) HAADF‐STEM image of NiSA@N‐Ti3C2Tx. K) Corresponding EDS analysis. L) and M) Atomically resolved HAADF‐STEM images. N) 3D atom‐overlapping Gaussian‐function fitting mapping for the g area in (L) illustrating the atomic structure and arrangement of NiSA@N‐Ti3C2Tx. O) Corresponding profiles of the h area in (M). Reproduced with permission.[ 87 ] Copyright 2024, The Royal Society of Chemistry.
Figure 5
Figure 5
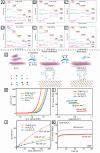
A) Pt L3‐edge XANES spectra, B) Fourier transforms of Pt L3, and C) WT Pt L3‐edge EXAFS spectra for Pt foil, PtO2, and Ti2CClx–PtSA. Reproduced with permission.[ 62 ] copyright 2024, Wiley‐VCH. D) Pd K‐edge EXAFS spectra of Pd foil, PdO, and 0.5% Pd1‐Ti3C2Tx. E) EXAFS fitting curves for 0.5% Pd1‐Ti3C2Tx. Reproduced with permission.[ 85 ] Copyright 2024, Elsevier. The experimental Ni K‐edge F) XANES and G) EXAFS spectra of Ni SA@N‐Ti3C2Tx and counterparts. Reproduced with permission.[ 87 ] Copyright 2024, The Royal Society of Chemistry. H) Normalized operando Ru K‐edge XANES spectra for SA Ru‐Mo2CTX under various conditions (applied voltage versus RHE) in 0.5 M K2SO4 solution, insert is the magnified image. I) The corresponding FT‐EXAFS spectra derived from (H). J) The oxidation state of Ru and radial distance of the main peak under various conditions. Reproduced with permission.[ 92 ] Copyright 2020, Wiley‐VCH.
Figure 6
Figure 6
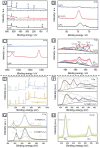
A) XPS survey spectra of Ti2AlC, MS‐Ti2CClx, and Ti2CClx. High‐resolution B) Al 2p, C) Zn 2p, and D) Ti 2p XPS spectra of Ti2AlC, MS‐Ti2CClx, and Ti2CClx. Reproduced with permission.[ 62 ] Copyright 2024, Wiley‐VCH. E) XPS survey spectra of CuSA@N‐Ti3C2Tx and CuSA@Ti3C2Tx, F) Ti 2p spectra, G) C 1s spectra, and H) Cu 2p spectra. Reproduced with permission.[ 94 ] Copyright 2024, Springer Nature.
Figure 7
Figure 7
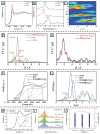
Raman spectra of A) Mo2TiC2Tx‐PtSA, B) delaminated Mo2TiC2Tx, C) Mo2TiAlC2 and Mo2TiC2Tx. Reproduced with permission.[ 79 ] Copyright 2018, Springer Nature. D,E) In situ Spectro‐electrochemical Raman spectra of Ti3C2Tx. F,G) In situ Raman spectra of RuSA@Ti3C2Tx. H,I) Schematic diagram of RuSA@Ti3C2Tx surface under operando HER conditions. Reproduced under the terms of the CC‐BY 4.0 license.[ 99 ] Copyright 2022, Wiley‐ VCH.
Figure 8
Figure 8
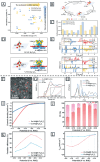
A) DFT‐calculated hydrogen adsorption Gibbs free energy of Ti2CClx–PtSA and 10% Pt/C for HER. B) DOS of Ti2CClx and Ti2CClx–PtSA. Reproduced with permission.[ 62 ] Copyright 2024, Wiley‐VCH. C) The charge density differences of TMs anchored onto NS/NN‐Ti3C2O2 supports. The charge depletion and accumulation are depicted by cyan and yellow, respectively. The isosurface value is 0.005 e/A3. The reaction mechanisms of ECO2RR to HCOOH under 0 V versus SHE and operando conditions on D) Cr‐NS‐Ti3C2O2, E) Ti‐NN‐Ti3C2O2, F) V‐NN‐Ti3C2O2, and G) Fe‐NN‐Ti3C2O2. Reproduced with permission.[ 101 ] Copyright 2024, Elsevier Ltd.
Figure 9
Figure 9
A) The calculated free‐energy diagrams for H adsorption on M−v−V2CT2 SACs. Reproduced with permission.[ 113 ] Copyright 2023, Elsevier Inc. B) The variation in ΔG (H) with the Group number of substitutional impurities in the Nb4C3O2 monolayer. The points corresponding to Nb (representing the pristine Nb4C3O2) and impurities giving rise to the eV are labeled. Reproduced with permission.[ 114 ] Copyright 2024, Springer Nature. C)The calculated ΔGH at the S1 and S2 sites on NM‐Mo2CO2 structures. Reproduced with permission.[ 115 ] Copyright 2024, Elsevier B.V. D) Illustration of the synthesis mechanism for Mo2TiC2O2–PtSA during the HER process. E) HER polarization curves of carbon paper (CP), Mo2TiC2Tx, Mo2TiC2Tx–VMo, Mo2TiC2Tx–PtSA and Pt/C (40%), acquired using graphite rod as the counter electrode in 0.5 M H2SO4 solution. F) Stability test of Mo2TiC2Tx–PtSA through potential cycling, before and after 10000 cycles. Inset: chronoamperometry curve of Mo2TiC2Tx–PtSA and Pt/C. Reproduced with permission.[ 79 ] Copyright 2018, Springer Nature. G) HER polarization curves of Ti2CTx, Ti2CClx, Ti2CClx–PtSA, and 10% Pt/C collected in 0.5 M H2SO4 electrolyte. H) Tafel plots of Ti2CTx, Ti2CClx, Ti2CClx–PtSA, and 10% Pt/C. I) The stability of Ti2CClx–PtSA. Reproduced with permission.[ 62 ] Copyright 2024, Wiley‐VCH. J) Schematic illustration of the fabrication of the Co@MXene composites on an example of V2CTx; K) HER LSV curves of Co@V2CTx, Co@Nb2CTx, Co@Ti3C2Tx and Pt/C electrodes at 5 mV s−1; L) HER chronopotentiometry response of three listed electrodes at a current density of 10 mA cm−2. Reproduced under the terms of the CC‐BY 4.0 license.[ 117 ] Copyright 2022, Wiley‐VCH GmbH.
Figure 10
Figure 10
Free energy diagrams of A) Fe‐H1‐V2CO2, B) Co‐H1‐V2CO2, C) Ni‐H1‐V2CO2, D) Co‐VO‐Nb2CO2, E) Ni‐H2‐Nb2CO2, and F) Co‐H2‐Ta2CO2. The steps marked in purple and yellow represent the PDS of the ORR and OER, respectively. Reproduced with permission.[ 124 ] Copyright 2024, Elsevier Inc. G) Schematic illustration of anchoring l‐tryptophan at the surface of Ti3C2Tx MXene, followed by fabrication of dual‐atom CoNi‐Ti3C2Tx composites. H) OER LSV curves of CoNi‐Ti3C2Tx, Ni‐Ti3C2Tx, Co‐Ti3C2Tx, and RuO2 electrodes at 5 mV s−1. I) Tafel slopes of CoNi‐Ti3C2Tx, Ni‐Ti3C2Tx, and Co‐Ti3C2Tx electrodes. J) Cdl values of CoNi‐Ti3C2Tx, Ni‐Ti3C2Tx and Co‐Ti3C2Tx. K) OER chronopotentiometry response of CoNi‐Ti3C2Tx electrodes at current densities of 10 and 500 mA cm−2. Reproduced with permission.[ 118 ] Copyright 2024, American Chemical Society.
Figure 11
Figure 11
A) The computed formation energy and dissolution potential of TMs in TM‐NS/NN‐Ti3C2O2. B) Schematic illustration of the reaction mechanism of ECO2RR toward HCOOH on TM‐NS/NN‐Ti3C2O2. C) Theoretical limiting potential UL of ECO2RR toward HCOOH on TM‐NS/NN‐Ti3C2O2. D) Adsorption configurations of *OCHO intermediate and charge density difference on Ti‐NN‐Ti3C2O2 and V‐NN‐Ti3C2O2. The isosurface values are 3 × 10⁻³ e Bohr−3. Yellow and cyan regions represent increasing and decreasing electron densities, respectively. E) Projected density of states of catalysts and *OCHO adsorption on catalysts of Cr‐NS‐Ti3C2O2 and Fe‐NN‐Ti3C2O2. Reproduced with permission.[ 101 ] Copyright 2024, Elsevier Ltd. F) HAADF‐STEM image of CuSA@N‐Ti3C2Tx. The experimental Cu K‐edge G) XANES and H) EXAFS spectra of CuSA@N‐Ti3C2Tx and counterparts. I) LSV curves of CuSA@N‐Ti3C2Tx, performed in CO2‐saturated 0.5 M KHCO3. J) Potential‐dependent FEs of H2 and CO for CuSA@N‐Ti3C2Tx, at different potentials. K) The CO FEs of CuSA@N‐Ti3C2Tx and CuSA@Ti3C2Tx at different potentials. L) Jco of CuSA@N‐Ti3C2Tx and CuSA@Ti3C2Tx. Reproduced with permission.[ 94 ] Copyright 2024, Springer Nature.
Figure 12
Figure 12
A) Top and side views of the atomic structure of TM/Ov‐MXene. Atom labels: C (white), Ti (blue), O (red), and TM (purple). The screened TM atoms (from Ti to Au) are listed. B) Summary of limiting potentials on TM/Ov‐MXene for NO3RR. C) Calculated formation energy of TM/Ov‐MXene (TM = 3d to 5d transition metals). Reproduced with permission.[ 132 ] Copyright 2023, Wiley‐VCH. D) Potential‐dependent Faradaic efficiency, NO3 removal, and NH3 selectivity for FeSA/MXene filter. E) Comparison of the highest Faradaic efficiency and NH3 selectivity for the FeSA/MXene filter at different NO3 concentrations. F) The NH3 yield rate of a FeSA/MXene filter in 0.1 M Na2SO4 electrolyte with different concentrations of NO3 . G) Gibbs free energy diagrams of nitrate reduction to NH3 and H2 evolution reaction (the top right) over FeSA/MXene and FeNP/MXene. Reproduced with permission.[ 135 ] Copyright 2023, American Chemical Society.

References

    1. a) Hu E., Feng Y., Nai J., Zhao D., Hu Y., Lou X. W., Energ. Environ. Sci. 2018, 11, 872;
    2. b) You B., Sun Y., Acc. Chem. Res. 2018, 51, 1571. - PubMed
    1. Luo Y., Zhang Z., Chhowalla M., Liu B., Adv. Mater. 2022, 34, 2108133. - PubMed
    1. a) Seh Z. W., Kibsgaard J., Dickens C. F., Chorkendorff I., Norskov J. K., Jaramillo T. F., Science 2017, 355, 146; - PubMed
    2. b) De Luna P., Hahn C., Higgins D., Jaffer S. A., Jaramillo T. F., Sargent E. H., Science 2019, 364, 350. - PubMed
    1. a) Dawood F., Anda M., Shafiullah G. M., Int. J. of Hydrogen Energ. 2020, 45, 3847;
    2. b) Wang Y.‐Z., Ding Y.‐M., Zhang C.‐H., Xue B.‐W., Li N.‐W., Yu L., Rare Met. 2021, 40, 2785;
    3. c) Jiang N., You B., Sheng M., Sun Y., Angew. Chem. Int. Ed. Engl. 2015, 54, 6251. - PubMed
    1. Mushtaq M. A., Kumar A., Liu W., Ji Q., Deng Y., Yasin G., Saad A., Raza W., Zhao J., Ajmal S., Wu Y., Ahmad M., Lashari N. U. R., Wang Y., Li T., Sun S., Zheng D., Luo Y., Cai X., Sun X., Adv. Mater. 2024, 36, 2313086. - PubMed

LinkOut - more resources