. 2025 May;12(20):e2413709.
doi: 10.1002/advs.202413709. Epub 2025 Mar 27.

UGDH Lactylation Aggravates Osteoarthritis by Suppressing Glycosaminoglycan Synthesis and Orchestrating Nucleocytoplasmic Transport to Activate MAPK Signaling

Affiliations

UGDH Lactylation Aggravates Osteoarthritis by Suppressing Glycosaminoglycan Synthesis and Orchestrating Nucleocytoplasmic Transport to Activate MAPK Signaling

Weiren Lan et al. Adv Sci (Weinh). 2025 May.

Abstract

Osteoarthritis (OA) progression is closely related to dysregulated glycolysis. As the primary metabolite of glycolysis, lactate plays a detrimental role in OA. However, how lactate exacerbates OA process remains unclear. Here, this study revealed that lactate levels are elevated in the synovial fluid of OA patients and IL-1β-treated human primary chondrocytes, promoting protein pan-lactylation. Functionally, hyper-lactylation exacerbates chondrocytes extracellular matrix (ECM) degradation and cell apoptosis in vitro and in vivo. Moreover, UDP-glucose dehydrogenase (UGDH) is proven to be the key lactylated protein in lactate-treated chondrocytes, which undergoes lactylation at lysine 6 (K6). Lactylated UGDH repressed its enzymatic activity, reducing glycosaminoglycan synthesis and disregulating its nuclear-cytoplasmic distribution. Mechanistically, K6 lactylation of UGDH impedes the interaction of UGDH and signal transducer and activator of transcription 1 (STAT1), thus promoting the transcription of mitogen-activated protein kinase kinase kinase 8 (MAP3K8) and activating the MAPK signaling pathway. Importantly, in vitro and in vivo treatment with A485, a specific acyltransferase P300 inhibitor, suppressed UGDH lactylation and rescued chondrocytes ECM degradation and OA progression. These findings uncover a new mechanism underlying OA pathogenesis and highlight the potential of targeting UGDH lactylation as a novel therapeutic strategy for OA.

Keywords: chondrocytes; lactate; lactylation; osteoarthritis; udp‐glucose dehydrogenase.


Conflict of interest statement

The authors declare no conflict of interest.

Figures

Figure 1
Figure 1
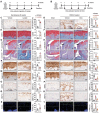
Pan‐lactylation is increased in OA articular cartilage and IL‐1β‐treated chondrocytes. A) Glycolysis related genes expression in joints of non‐OA donors and OA patients according to single‐cell RNA sequencing data. B) Relative lactate production of synovial fluid in non‐OA (n = 10 per group) and OA (n = 10 per group) patients. C) Relative lactate production of chondrocytes with IL‐1β (10 ng ml−1) treatment for 0, 2, 4, 6, 12, and 24 h. D) Safranin O staining (top panel) and pan‐lactylation immunohistochemistry (IHC) staining (bottom panel) of the cartilage from OA patients (4 samples per group). Scale bars, 50 µm. E) Safranin O and Fast Green staining (SOFG) staining (top panel) and pan‐lactylation IHC staining (bottom panel) of the cartilage from DMM‐induced OA mice at 0, 2, 4, and 8 weeks (4 samples per group). Scale bars, 50 µm. Data were presented as mean ± SD and analyzed by Student's t‐test (B) or One‐way analysis of variance (ANOVA) with Dunnett's post hoc test (C,D,E). N represents the number of independent repeated experiments or sample size. Osteoarthritis Research Society International (OARSI) grade were shown as mean ± 95% confidence interval (CI) and Mann‐Whitney U test for statistical analysis (D,E). NS: no significance, *p < 0.05, **p < 0.01, ***p < 0.001, and ****p < 0.0001.
Figure 2
Figure 2
Hyper‐lactylation aggravates OA progression in vivo. A,B) Schematic diagram of animals experiment design. C) Immunohistochemistry (IHC) of pan‐lactylation of articular cartilage in non‐surgical mice with lactate or PBS (n = 8 per group). Scale bars, 50 µm. D) IHC of pan‐lactylation of articular cartilage in sham, DMM induced OA mice with DCA or PBS (n = 8 per group). Scale bars, 50 µm. E) Safranin O and Fast Green staining (SOFG) of articular cartilage in non‐surgical mice with lactate or PBS. OARSI grade was measured according to SOFG staining. Scale bars, 50 µm. F) SOFG of articular cartilage in sham, DMM induced OA mice with DCA or PBS. OARSI grade was measured according to SOFG staining. Scale bars, 50 µm. G) SOFG of osteophyte (arrow mark) in non‐surgical mice with lactate or PBS. Osteophyte score for analysis of osteophyte formation. Scale bars, 100 µm. H) SOFG of osteophyte (arrow mark) in sham, DMM induced OA mice with DCA or PBS. Osteophyte score for analysis of osteophyte formation. Scale bars, 100 µm. I) SOFG of synovium (rectangle mark) in non‐surgical mice with lactate or PBS. Synovium score for analysis of synovitis. Scale bars, 100 µm. J) SOFG of synovium (rectangle mark) in sham, DMM induced OA mice with DCA or PBS. Synovium score for analysis of synovitis. Scale bars, 100 µm. IHC of Collagen II K), Aggrecan M), MMP3 O), and MMP13 Q) of articular cartilage in non‐surgical mice with lactate or PBS. Scale bars, 50 µm. IHC of Collagen II L), Aggrecan N), MMP3 P) and MMP13 R) of articular cartilage in sham, DMM induced OA mice with DCA or PBS. Scale bars, 50 µm. S) TUNEL analysis of articular cartilage in non‐surgical mice with lactate or PBS. Green fluorescence represented TUNEL positive cells. Blue fluorescence (DAPI) represented all cells. Scale bars, 100 µm. T) TUNEL analysis of articular cartilage in sham, DMM induced OA mice with DCA or PBS. Green fluorescence represented TUNEL positive cells. Blue fluorescence (DAPI) represented all cells. Scale bars, 100 µm. Data were presented as mean ± SD and analyzed by Student's t‐test (C,K,M,O,Q,S) or One‐way analysis of variance (ANOVA) with Dunnett's post hoc test (D,L,N,P,R,T). N represents the number of sample size. Scores of OARSI, osteophyte and synovitis were shown as mean ± 95% CI and Mann‐Whitney U test for statistical analysis (E,F,G,H,I,J).NS: no significance, *p < 0.05, **p < 0.01, ***p < 0.001, and ****p < 0.0001.
Figure 3
Figure 3
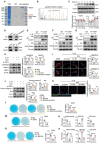
UGDH lactylation accounts for ECM degradation and chondrocyte apoptosis. A) Coomassie bright blue stain of lactylated proteins lysate after CoIP test with lactylation antibody and SDS‐PAGE (10% gel). B) The specific peptide of UGDH in lactylated bands was identified by mass spectrometry analysis. C) Western blot analysis of UGDH and lactylation (Kla) of UGDH band site in chondrocytes with IL‐1β (10 ng ml−1) treatment for 0, 2, 4, 6, 12, and 24 h. The data were normalized to β‐actin. D) COIP of UGDH by lactylation antibody and reverse verification of lactylation in UGDH band site by UGDH antibody. E‐G) Western blot of UGDH lactylation in chondrocytes with IL‐1β (10 ng ml−1) (E) or lactate (25 mm) (F) or DCA (20 mm) (G) treatment for 24 h. H) Western blot of MMP3, MMP13 and ADAMTS4 in chondrocytes with PBS (control group) or IL‐1β (10 ng ml−1) or IL‐1β (10 ng ml−1) + DCA (20 mm) or IL‐1β (10 ng ml−1) + DCA (20 mm) + si‐UGDH (UGDH siRNA) treatment. The data were normalized to β‐actin. I) Immunofluorescence staining of Collagen II and Aggrecan in chondrocytes with PBS (control group) or IL‐1β (10 ng ml−1) or IL‐1β (10 ng ml−1) + DCA (20 mm) or IL‐1β (10 ng ml−1) + DCA (20 mm) + si‐UGDH (UGDH siRNA) treatment. Scale bar, 25 µm. J) Western blot of cleaved‐caspase 3, Bax and Bcl‐2 in chondrocytes with PBS (control group) or IL‐1β (10 ng ml−1) or IL‐1β (10 ng ml−1) + DCA (20 mm) or IL‐1β (10 ng ml−1) + DCA (20 mm) + si‐UGDH (UGDH siRNA) treatment. The data were normalized to β‐actin. K) Representative immunofluorescence images of Annexin V (green) and PI (red) in chondrocytes with PBS (control group) or IL‐1β (10 ng ml−1) or IL‐1β (10 ng ml−1) + DCA (20 mm) or IL‐1β (10 ng ml−1) + DCA (20 mm) + si‐UGDH (UGDH siRNA) treatment. Scale bar, 100 µm. L) Alcian blue staining and ELISA assay of GAGs in chondrocytes with PBS (control group) or IL‐1β (10 ng ml−1) or IL‐1β (10 ng ml−1) + DCA (20 mm) or IL‐1β (10 ng ml−1) + DCA (20 mm) + si‐UGDH (UGDH siRNA) treatment. M) Alcian blue staining and ELISA assay of GAGs in chondrocytes with lactate treatment. N) UGDH activity, UDP‐Glc and UDP‐GlcA concentrations measurements in chondrocytes after lactate treatment. O) Alcian blue staining and ELISA assay of GAGs in chondrocytes with DCA (20 mm) treatment in the presence of IL‐1β. P) UGDH activity, UDP‐Glc and UDP‐GlcA concentrations measurements in chondrocytes with DCA (20 mm) treatment in the presence of IL‐1β. All data were presented as mean ± SD and analyzed by Student's t‐test or One‐way analysis of variance (ANOVA) with Dunnett's post hoc test. N represents the number of independent repeated experiments. NS: no significance, *P < 0.05, **P < 0.01, ***P < 0.001, and ****P < 0.0001.
Figure 4
Figure 4
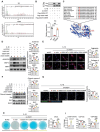
K6 and K399 residues are the lactylated lysine sites in UGDH. A) Lactylated sites of UGDH were identified by liquid chromatography and mass spectrometry analysis. B) Lactylation (Kla) assay of WT UGDH or K6 and K399 sites mutant in UGDH. Chondrocytes were transfected with Flag‐UGDH WT or Flag‐UGDH K6R or Flag‐UGDH K399R plasmids. Flag tagged UGDH was purified by Anti‐Flag antibody. C) K6 site (marked as red) of UGDH is highly conserved. The sequences (4th‐24th amino acids) around UGDH K6 site from different species were aligned. D) Western blot analysis of MMP3, MMP13 and ADAMTS4 in chondrocytes with Flag‐UGDH WT or Flag‐UGDH K6R or Flag‐UGDH K399R plasmids transfection in the presence of IL‐1β (10 ng ml−1) and UGDH siRNA. The data were normalized to β‐actin. E) Immunofluorescence staining of Collagen II and Aggrecan in chondrocytes with Flag‐UGDH WT or Flag‐UGDH K6R or Flag‐UGDH K399R plasmids transfection in the presence of IL‐1β (10 ng ml−1) and UGDH siRNA. Scale bar, 25 µm. F Western blot of cleaved‐caspase 3, Bax and Bcl‐2 in chondrocytes with Flag‐UGDH WT or Flag‐UGDH K6R or Flag‐UGDH K399R plasmids transfection in the presence of IL‐1β (10 ng ml−1) and UGDH siRNA. The data were normalized to β‐actin. G) Representative immunofluorescence images of Annexin V (green) and PI (red) in chondrocytes with Flag‐UGDH WT or Flag‐UGDH K6R or Flag‐UGDH K399R plasmids transfection in the presence of IL‐1β (10 ng ml−1) and UGDH siRNA. Scale bar, 100 µm. H) Alcian blue staining and ELISA assay of GAGs in chondrocytes with Flag‐UGDH WT or Flag‐UGDH K6R or Flag‐UGDH K399R plasmids transfection in the presence of IL‐1β (10 ng ml−1) and UGDH siRNA. I) UGDH activity, UDP‐Glc and UDP‐GlcA concentrations measurements in chondrocytes with Flag‐UGDH WT or Flag‐UGDH K6R or Flag‐UGDH K399R plasmid transfection in the presence of IL‐1β (10 ng ml−1) and UGDH siRNA. All data were presented as mean ± SD and analyzed by One‐way analysis of variance (ANOVA) with Dunnett's post hoc test. N represents the number of independent repeated experiments. NS: no significance, *P < 0.05, **P < 0.01, ***P < 0.001, and ****P < 0.0001.
Figure 5
Figure 5
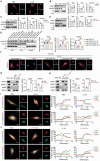
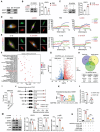
Lactylation of UGDH facilitates its nucleus to cytoplasm translocation. A) Representative immunofluorescence images of UGDH in the presence of IL‐1β (10 ng ml−1) or PBS. Scale bar, 25 µm. B–D) Western blot analysis of total UGDH, UGDH in cytoplasm (cyto) and nucleus under the stimulation of IL‐1β (10 ng ml−1) (B) or lactate (25 mm) (C) or DCA (20 mm) (D) and their relative control. Total UGDH and UGDH in cytoplasm were normalized to GAPDH. UGDH in nucleus was normalized to histone 3 (H3). E,F) Western blot analysis and representative immunofluorescence images of Flag‐UGDH WT, Flag‐UGDH K6R and Flag‐UGDH K399R in chondrocytes. Scale bar, 20 µm. G) Interaction assay of UGDH with CRM1, KPNA2 and KPNB in PBS or lactate (25 mm) treated chondrocytes. CoIP was conducted with Anti‐UGDH antibody. H) Interaction assay of UGDH with CRM1, KPNA2 and KPNB in IL‐1β (10 ng ml−1) or IL‐1β (10 ng ml−1) + DCA (20 mm) treated chondrocytes. CoIP was conducted with Anti‐UGDH antibody. I) Representative immunofluorescence images of UGDH (red) with CRM1 (green) or KPNA2 (green) in PBS or lactate (25 mm) treated chondrocytes. Scale bar, 20 µm (n = 4). J) Representative immunofluorescence images of UGDH (red) with CRM1 (green) or KPNA2 (green) in IL‐1β (10 ng ml−1) or IL‐1β (10 ng ml−1) + DCA (20 mm) treated chondrocytes. Scale bar, 20 µm. All data were presented as mean ± SD and analyzed by Student's t‐test. N represents the number of independent repeated experiments. NS: no significance, *P < 0.05, **P < 0.01, ***P < 0.001, and ****P < 0.0001.
Figure 6
Figure 6
Lactylation of UGDH inhibits its interaction with STAT1 and promotes STAT1 mediated MAP3K8 transcription. A) CoIP of STAT1 by UGDH antibody. B) Interaction assay of UGDH with STAT1 in PBS or lactate (25 mm) treated chondrocytes. CoIP was conducted with Anti‐UGDH antibody. The data were normalized to UGDH. C) Interaction assay of UGDH with STAT1 in IL‐1β (10 ng ml−1) or IL‐1β (10 ng ml−1) + DCA (20 mm) treated chondrocytes. CoIP was conducted with Anti‐UGDH antibody. The data were normalized to UGDH. D) Representative immunofluorescence images of UGDH (green) with STAT1 (red) in PBS or lactate (25 mm) treated chondrocytes. Scale bar, 20 µm. E) Representative immunofluorescence images of UGDH (green) with STAT1 (red) in IL‐1β (10 ng ml−1) or IL‐1β (10 ng ml−1) + DCA (20 mm) treated chondrocytes. Scale bar, 20 µm. F) Statistics of pathway enrichment. Data from CHIP‐seq with anti‐STAT1 antibody. G) Volcano plot of a transcriptome profiling dataset involving ten IL‐1β treated human chondrocytes and its negative controls (GSE162510). H) Venn plot of the genes of CHIP‐seq, MAPK pathway related genes and upregulated genes in IL‐1β treated chondrocytes and its log2(fc) and p value. I) Relative quantification of ChIP‐qPCR for MAP3K8. J) Binding region prediction assay of STAT1 at MAP3K8 promoter. HEK293T cells were transfected with luciferase reporter gene (luc) labeled plasmids containing truncated MAP3K8 promoter and treated with STAT1 vetor (control) or STAT1 plasmids (STAT1 OE) for 24 h, followed by luciferase reporter assays. K) Predicted binding site of STAT1 at MAP3K8 promoter by JASPAR online tools. L) Luciferase reporter assays. HEK293T cells were transfected with luciferase reporter gene labeled plasmids containing WT MAP3K8 promoter (WT) or mutated MAP3K8 promoter (MUT) under the treatment of STAT1 vetor (control) or STAT1 plasmids (STAT1 OE) for 24 h. M) Western blot of STAT1, MAP3K8 and p‐p38 in chondrocytes with PBS (control group) or lactate (25 mm) or lactate (25 mm) + si‐STAT1 (STAT1 siRNA) treatment (n = 4). N HEK293T cells were transfected with UGDH WT, UGDH K6R, UGDH K399R plasmids under the treatment of STAT1 plasmids and luciferase reporter gene labeled MAP3K8 WT plasmids, followed by luciferase reporter assays. The data were normalized to β‐actin. All data were presented as mean ± SD and analyzed by Student's t‐test or One‐way analysis of variance (ANOVA) with Dunnett's post hoc test. N represents the number of independent repeated experiments. NS: no significance, *P < 0.05, **P < 0.01, ***P < 0.001, and ****P < 0.0001.
Figure 7
Figure 7
P300 inhibitor A485 rescues OA progression in vivo and in vitro. A) CoIP of UGDH with Anti‐UGDH antibody, follow by Western blot analysis of P300, PCAF, GCN5, and CBP. B) Western blot of P300 in chondrocytes with IL‐1β (10 ng ml−1) treatment for 0, 2, 4, 6, 12, and 24 h. The data were normalized to β‐actin. C) Immunohistochemistry (IHC) of P300 in the cartilage from OA patients (5 samples per group). Scale bars, 50 µm. D) Western blot analysis of MMP3, MMP13 and ADAMTS4 expression in chondrocytes transfected with P300 overexpression (OE) and treated with A485. The data were normalized to β‐actin (n = 4). E) Immunofluorescence staining of Aggrecan and Collagen II in the same conditions as in D (n = 4). Scale bar, 25 µm. F) Western blot analysis of cleaved‐caspase 3, Bax, and Bcl‐2 expression with quantification normalized to β‐actin (n = 4). G) Representative immunofluorescence images of Annexin V (green) and PI (red) in chondrocytes, with quantification of apoptotic cell percentage (n = 4). Scale bar, 100 µm. H) IHC of pan‐lactylation of articular cartilage in sham, DMM induced OA mice with A485 or DMSO. (8 mice per group). Scale bars, 50 µm. SOFG of articular cartilage, osteophyte (arrow mark) and synovium (rectangle mark) in sham, DMM induced OA mice with A485 or DMSO. OARSI grade was measured according to SOFG staining. Scale bars, 50 µm. Osteophyte score for analysis of osteophyte formation. Scale bars, 100 µm. Synovium score for analysis of synovitis. Scale bars, 100 µm. Alcian blue staining of articular cartilage in sham, DMM induced OA mice with A485 or DMSO. Scale bars, 50 µm. TUNEL analysis of articular cartilage in sham, DMM induced OA mice with A485 or DMSO. Green fluorescence represented TUNEL positive cells. Blue fluorescence (DAPI) represented all cells. Scale bars, 100 µm. Data were presented as mean ± SD and analyzed by One‐way analysis of variance (ANOVA) with Dunnett's post hoc test. Scores of OARSI, osteophyte and synovitis were shown as mean ± 95% CI and Mann‐Whitney U test for statistical analysis. N represents the number of independent repeated experiments or sample size. NS: no significance, *P < 0.05, **P < 0.01, ***P < 0.001, and ****P < 0.0001.

References

    1. Duong V., Oo W. M., Ding C., Culvenor A. G., Hunter D. J., JAMA, J. Am. Med. Assoc. 2023, 330, 1568. - PubMed
    1. Hunter D. J., Osteoarthritis B.‐Z. S., Lancet 2019, 393, 1745. - PubMed
    1. Catheline S. E., Bell R. D., Oluoch L. S., James M. N., Escalera‐Rivera K., Maynard R. D., Chang M. E., Dean C., Botto E., Ketz J. P., Boyce B. F., Zuscik M. J., Jonason J. H., Sci. Signal. 2021, 14, abf3535. - PMC - PubMed
    1. Fazio A., Di Martino A., Brunello M., Traina F., Marvi M. V., Mazzotti A., Faldini C., Manzoli L., Evangelisti C., Ratti S., J. Orthop. Transl. 2024, 47, 116. - PMC - PubMed
    1. Herrero‐Beaumont G., Pérez‐Baos S., Sánchez‐Pernaute O., Roman‐Blas J. A., Lamuedra A., Largo R., Biochem. Pharmacol. 2019, 165, 24. - PubMed

Substances

LinkOut - more resources