Randomized Controlled Trial
. 2025 Oct;41(5):501-515.
doi: 10.1111/edt.13062. Epub 2025 Mar 27.

Microbial Loads in Traumatized Immature Teeth and Their Impact on the Treatment Outcomes of Regenerative Endodontic Treatment: A Randomized Clinical Trial Comparing Chlorhexidine and Calcium Hydroxide

Affiliations
Randomized Controlled Trial

Microbial Loads in Traumatized Immature Teeth and Their Impact on the Treatment Outcomes of Regenerative Endodontic Treatment: A Randomized Clinical Trial Comparing Chlorhexidine and Calcium Hydroxide

Alina Wikström et al. Dent Traumatol. 2025 Oct.

Abstract

Introduction: Regenerative endodontic treatment (RET) aims to promote root maturation in necrotic immature teeth, where effective microbial disinfection is crucial for treatment success. This study evaluated the effect of calcium hydroxide (CH) and 2% chlorhexidine gluconate (CHD) as intracanal medicaments and their impact on bacterial loads and RET outcomes.

Methods: The material consisted of bacterial samples from 41 patients who participated in a previously conducted randomized controlled clinical trial comparing CH and CHD during RET. A total of 123 microbial samples were analyzed using real-time quantitative polymerase chain reaction (qPCR). Bacterial loads were assessed at three time points: before root canal disinfection (S1), after root canal disinfection (S2), and after intracanal dressing (S3). The microbial composition was evaluated at the kingdom (Eubacteria), phylum (Actinomycetota), and species (Enterococcus faecalis) levels.

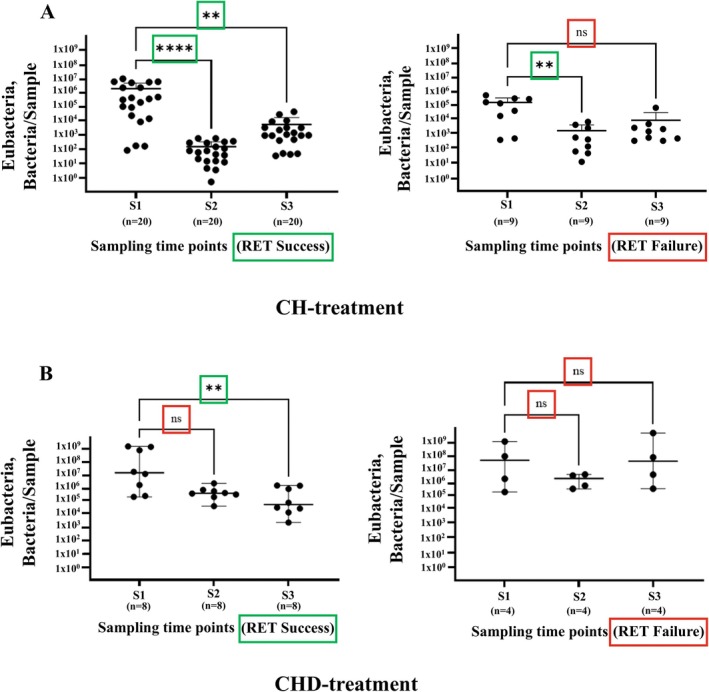
Results: Significant reductions in bacterial loads were observed after root canal disinfection (S2) in both CH and CHD subgroups, regardless of treatment outcome. Further reductions after intracanal dressing (S3) occurred exclusively in the successful cases. Actinomycetota loads significantly decreased after root canal disinfection in the successful cases but remained unchanged after intracanal medication. The presence of E. faecalis after intracanal dressing was associated with failed RET (OR = 9.778; p = 0.0432), although no significant differences in the effectiveness of the intracanal medicaments were found.

Conclusion: Both CH and CHD effectively reduced bacterial loads, with greater reductions linked to successful outcomes. The association between E. faecalis and failed RET suggests that this species may play a role in treatment outcomes. Further research, including microbiome profiling, is desirable to identify potential prognostic markers for failed RET.

Keywords: antibacterial effectiveness of calcium hydroxide and 2% chlorhexidine; bacterial loads; immature traumatized teeth; quantitative polymerase chain reaction; regenerative endodontic treatment.


Conflict of interest statement

The authors declare no conflicts of interest.

Figures

FIGURE 1
FIGURE 1
Flow‐chart of the sampling time‐points during regenerative endodontic treatment.
FIGURE 2
FIGURE 2
qPCR estimation of total loads of Eubacteria. Loads are shown at different time points (S1, S2, and S3) following (A) calcium hydroxide (CH) and (B) chlorhexidine (CHD) treatment. The samples were grouped based on the regenerative endodontic treatment (RET) outcome: Success (left panel) and failure (right panel). Bacterial loads are expressed as a number of bacterial cells per sample, converted from genomic DNA concentrations measured in nanograms per microliter(ng/μL). The figure is based on the number of samples for the CH‐subgroup: RET Success (n = 20) and RET Failure (n = 4); CHD‐subgroup: RET Success (n = 8) and RET Failure (n = 4). Each dot represents individual sample data, and the bars represent the mean value of S1, S2, or S3 grouped samples with SD. The data were analyzed using the Kruskal–Wallis test and Dunn's multiple comparison tests. Statistically significant differences are marked as “**” p = 0.01; “ns” p > 0.05.
FIGURE 3
FIGURE 3
qPCR estimation of total loads of Actinomycetota. Loads are shown at different time points (S1, S2, and S3) following (A) calcium hydroxide (CH) and (B) chlorhexidine (CHD) treatment. The samples were grouped based on the outcome of regenerative endodontic treatment (RET): Success (left panel) and failure (right panel). The figure is based on number of samples for the CH‐subgroup: RET Success (n = 20) and RET Failure (n = 4); CHD‐subgroup: RET Success (n = 8) and RET Failure (n = 4). Bacterial loads are expressed as a number of bacterial cells per sample, converted from genomic DNA concentrations measured in nanograms per microliter (ng/μL). Each dot represents individual sample data, and the bars represent the mean value of S1, S2 or S3 with SD. Data were analyzed using the Kruskal–Wallis test and Dunn's multiple comparison tests. Statistically significant differences are marked with “**” p = 0.01; “ns” p > 0.05.
FIGURE 4
FIGURE 4
Odds ratios for failure of RET in the presence of Actinomycetota in the CH subgroup. RET outcome ratio in Actinomycetota positive versus Actinomycetota negative samples in the subgroup of CH‐treated root canals. The data are presented as the total number of analyzed samples. Differences between the ratio of successful and failed RET was estimated by chi‐squared test, and statistical significance was estimated by Fisher's exact test. The statistical significance was set at p < 0.05. The 95% CI = 0.0783–1.962 for OR at S1 sampling. The 95% CI = 0.4373–8.251 for OR at S2 sampling. The 95% CI = 0.2416–5.346 for OR at S3 sampling.
FIGURE 5
FIGURE 5
qPCR estimation of total loads of E. faecalis . Loads are shown at different time points (S1, S2, and S3) following (A) calcium hydroxide (CH) and (B) chlorhexidine (CHD) treatment. The samples were grouped based on the outcome of regenerative endodontic treatment (RET): Success (left panel) and failure (right panel). Bacterial loads are expressed as a number of bacterial cells per sample, converted from genomic DNA concentrations measured in nanograms per microliter (ng/μL). Each dot represents individual sample data, and the bars represent the mean value of S1, S2, or S3 with SD. Data were analyzed using the Kruskal–Wallis test and Dunn's multiple comparison tests. Statistically significant differences are marked with “**” p = 0.01; “ns” p > 0.05.
FIGURE 6
FIGURE 6
Odds ratios for failure of RET in the presence of E. faecalis in the CH subgroup (A) and in the CHD subgroup (B). RET outcome ratio in E. faecalis positive versus E. faecalis negative samples according to the intracanal medication. The data are presented as percentages of the total number of analyzed samples. The differences between the ratio of successful versus failed RET was estimated by chi‐square test (except those samplings when at least one event frequency was zero), and statistical significance was estimated by Fisher's exact test. Statistical significance was set at p < 0.05. In the CH‐subgroup (A): the 95% CI = 1.166–116.8 for OR at S3 sampling. In the CHD‐subgroup (B): the 95% CI = 0.053–11.16 for OR at S1 sampling; the 95% CI = 17.59–14.74 for OR at S2 sampling.
FIGURE 7
FIGURE 7
Comparison of the disinfection efficacy of calcium hydroxide and chlorhexidine gluconate in successful versus failed RET outcomes. Disinfection efficacy in the successful versus failed RET outcomes, calcium hydroxide and chlorhexidine subgroups. Each dot represents the individual value of disinfection efficacy. The boxes represent the range of standard deviation, the horizontal lines in the boxes represent the median value per group, and the whiskers represent the minimum and maximum values. The data set was analysed using Šídák's multiple comparisons test. Statistically significant difference was accepted at the level < 0.05. Disinfection efficacy was calculated using the formula Efficacy = Log N0/N, where N0 represents the bacterial cell number based on concentration of DNA/sample before root canal debridement at S1 and N represents the bacterial cell number based on concentration of DNA/sample after root canal disinfection at S3. “ns” – not significant; “RET success” – successful cases of pulp regenerative treatment; “RET failure” –failed cases of pulp regenerative treatment.

References

    1. Nagata J. Y., Soares A. J., Souza‐Filho F. J., et al., “Microbial Evaluation of Traumatized Teeth Treated With Triple Antibiotic Paste or Calcium Hydroxide With 2% Chlorhexidine Gel in Pulp Revascularization,” Journal of Endodontia 40, no. 6 (2014): 778–783, 10.1016/j.joen.2014.01.038. - DOI - PubMed
    1. Banchs F. and Trope M., “Revascularization of Immature Permanent Teeth With Apical Periodontitis: New Treatment Protocol?,” Journal of Endodontia 30 (2004): 196–200. - PubMed
    1. Hargreaves K. M., Diogenes A., and Teixeira F. B., “Treatment Options: Biological Basis of Regenerative Endodontic Procedures,” Pediatric Dentistry 35 (2013): 129–140. - PubMed
    1. Liu Q., Gao Y., and He J., “Stem Cells From the Apical Papilla (SCAPs): Past, Present, Prospects, and Challenges,” Biomedicine 11 (2023): 2047. - PMC - PubMed
    1. Chrepa V., Pitcher B., Henry M. A., and Diogenes A., “Survival of the Apical Papilla and Its Resident Stem Cells in a Case of Advanced Pulpal Necrosis and Apical Periodontitis,” Journal of Endodontia 43 (2017): 561–567. - PubMed

Publication types

MeSH terms

LinkOut - more resources