. 2025 Mar 27;6(4):e70148.
doi: 10.1002/mco2.70148. eCollection 2025 Apr.

Transforming Growth Factor Beta2 Promotes Migration and Inhibits the Proliferation of Gastric Cancer Cells by Regulating the pSmad2/3-NDRG1 Signaling Pathway

Affiliations

Transforming Growth Factor Beta2 Promotes Migration and Inhibits the Proliferation of Gastric Cancer Cells by Regulating the pSmad2/3-NDRG1 Signaling Pathway

Feng-Jun He et al. MedComm (2020). .

Abstract

Transforming growth factor beta2 (TGFβ2) is upregulated in gastric cancer (GC), playing a crucial role in driving its progression. However, the biological effects of TGFβ2 in GC metastasis and proliferation remain not fully understood. Our study reveals that TGFβ2 enhances N-myc downstream-regulated gene 1 (NDRG1) protein expression by activating the TGFβR/Smad2/3-dependent pathway, accelerating GC progression. TGFβ2 knockdown downregulates NDRG1 by inhibiting the TGFβR/Smad2/3 signaling pathway, which in turn inhibits GC cell migration and epithelial-mesenchymal transition (EMT) but stimulates proliferation. Both TGFβ2 upregulation and NDRG1 upregulation enhance GC cell migration in vitro and promote lung metastasis in mouse models. Interfering with NDRG1 reverses TGFβ2-induced migration, and inhibiting Smad2/3 or TGFβR reverses TGFβ2-induced NDRG1 upregulation and GC cell migration. Clinical sample analysis shows high TGFβ2 and NDRG1 expression in GC, associated with poor prognosis. Our study reveals that TGFβ2 upregulates NDRG1 via the TGFβR/Smad2/3 pathway, driving GC progression and highlighting the potential role of the TGFβ2NDRG1 axis in GC-targeted therapies.

Keywords: N‐myc downstream‐regulated gene 1; gastric cancer; metastasis; proliferation; transforming growth factor beta2.


Conflict of interest statement

The authors declare no conflicts of interest.

Figures

FIGURE 1
FIGURE 1
The expression levels of TGFβ2 in gastric cancer tissues and normal tissues were analyzed using data from the TCGA and GTEx databases (A). The relationship between TGFβ2 expression levels and overall survival time was analyzed (B). Representative images of IHC staining in gastric cancer tissues and adjacent noncancerous tissues, using an antibody against TGFβ2, are shown (C). In 212 paired samples, TGFβ2 expression was significantly different between gastric cancer tissues and adjacent noncancerous tissues (D). The effects of stable TGFβ2 interference and overexpression in gastric cancer cell lines were confirmed by Western blot analysis (E). Analysis of gastric cancer samples revealed a significant association between upregulated TGFβ2 expression and 5‐year overall survival in patients with gastric cancer (F). TGFβ2 interference and overexpression were validated at the RNA level (G) (scale bars: 500 and 50 µm). Statistical significance is indicated as follows: **p < 0.01, ***p < 0.001.
FIGURE 2
FIGURE 2
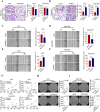
Migration assays of AGS and MGC803 cells with TGFβ2 interference or overexpression were performed (A), and corresponding statistical analyses are shown on the right side (B). The metastatic ability of TGFβ2‐overexpressing MGC803 cells was assessed by in vivo imaging using D‐Luciferin (C), and the corresponding quantitative analysis of fluorescence intensity is shown on the right side (D). TGFβ2 expression was immunohistochemically detected in lung metastatic tumors from mice (E) (scale bars: 500 and 50 µm). The proliferation rates of AGS and MGC803 cells in different treatment groups were measured using the CCK‐8 assay (F). The colony‐formation ability of AGS and MGC803 cells was compared using a plate colony assay in different treatment groups (G), and the corresponding statistical analyses are shown on the right side (H). Statistical significance is indicated as follows: *p < 0.05, ***p < 0.001.
FIGURE 3
FIGURE 3
The heatmap shows the top 30 genes with significant expression changes identified by RNA sequencing following TGFβ2 overexpression (A). Western blotting was performed to analyze TGFβ2 and NDRG1 expression in AGS and MGC803 cells, with GAPDH as the loading control (B, D). The mRNA levels of NDRG1 in AGS and MGC803 cells were measured by real‐time qPCR, with GAPDH as the loading control (C, E). NDRG1 (orange) was detected in AGS and MGC803 cells by immunofluorescence staining (F). NDRG1 expression in AGS and MGC803 cells was analyzed by Western blotting and real‐time qPCR, with GAPDH as the loading control (G, H). NDRG1 expression in AGS and MGC803 cells was further confirmed by Western blotting and real‐time qPCR, with GAPDH as the loading control (I–K). Statistical significance is indicated as follows: *p < 0.05, **p < 0.01, ***p < 0.001.
FIGURE 4
FIGURE 4
Migration assays were conducted in AGS and MGC803 cells with NDRG1 interference or overexpression, with statistical analyses shown on the right (A, B). Wound healing assays further measured the migratory capacity of these cells under the same conditions (C–F; statistics shown right). Proliferation rates of cells in different treatment groups (control, NDRG1‐interfered, and NDRG1‐overexpressed) were assessed using the CCK‐8 assay (G). Colony formation ability was compared across groups via colony formation assay (H, I; statistics shown right). *p < 0.05, **p < 0.01, ***p < 0.001.
FIGURE 5
FIGURE 5
The lung metastatic ability of NDRG1‐overexpressing MGC803 cells was measured by in vivo imaging using D‐Luciferin, and the corresponding quantitative analysis of fluorescence intensity is shown on the right side (A). NDRG1 expression was immunohistochemically detected in lung metastatic tumors from mice (B). The migration assay of AGS and MGC803 cells with NDRG1 expression interference, cocultured with exogenous recombinant TGFβ2 protein, is displayed on the right side (C, D), along with corresponding statistical analyses. As the concentration of exogenous recombinant human TGFβ2 increased, the inhibition of GC cell proliferation became more significant (E). Overexpression of TGFβ2 promoted cell migration and upregulated NDRG1 expression, which was reversed by NDRG1 knockdown (F, G) (scale bars: 500 and 50 µm). Statistical significance is indicated as follows: *p < 0.05, **p < 0.01, ***p < 0.001.
FIGURE 6
FIGURE 6
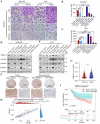
Western blotting of TGFβ2, Smad2/3, pSmad2/3, E‐cadherin, and N‐cadherin expression in AGS and MGC803 cells with TGFβ2 interference or overexpression. GAPDH served as the internal control (A). Effects of SIS3 concentration on NDRG1 expression in AGS and MGC803 cells (B). Effect of TGFβ /Smad inhibitor Trabedersen on NDRG1 expression in MGC803 cells (C). Effect of siRNA interference on Smad2/3 expression (D). Interference of Smad2, Smad3, and SMAD2/3 expression on NDRG1 protein and RNA level in AGS and MGC803 cells (E, F). PCR‐amplified products from ChIP assays of MGC803 cells were detected by Southern blotting. Input acted as a positive control, while IgG served as a negative control (G, H). Statistical significance is indicated as follows: *p < 0.05, ***p < 0.001, ns: not significant.
FIGURE 7
FIGURE 7
Migration assays of AGS and MGC803 cells following the interference of Smad2, Smad3, or SMAD2/3 expression, respectively, with corresponding statistical analyses shown on the right side (A−C) (scale bars: 100 µm). Western blotting of Smad2/3, pSmad2/3, and NDRG1 expression in AGS and MGC803 cells (D, E). Representative IHC staining for NDRG1 in gastric cancer samples (F) with corresponding statistical analyses (G) shown on the right side (scale bars: 100 and 500 µm). Spearman correlation analysis of IHC staining scores of TGFβ2 and NDRG1: r = 0.74, p < 0.001 (H). Relationship between NDRG1 expression levels in gastric cancer tissues and patient OS (I): p = 0.0027. Statistical significance is indicated as follows: **p < 0.01, ***p < 0.001, ns: not significant.

References

    1. Sung H., Ferlay J., Siegel R. L., et al., “Global Cancer Statistics 2020: GLOBOCAN Estimates of Incidence and Mortality Worldwide for 36 Cancers in 185 Countries,” CA: A Cancer Journal for Clinicians 71, no. 3 (2021): 209–249. - PubMed
    1. Chinese Gastric Cancer Association of Chinese Anti‐Cancer Association , Chinese Society of Upper Gastrointestinal Surgeons of Chinese Medical Doctor Association , and Chinese Health Risk Management Collaboration‐Gastric Cancer Group , “[Chinese Guideline on Risk Management of Gastric Cancer in the General Public(2023 Edition)],” Zhonghua Yi Xue Za Zhi 103, no. 36 (2023): 2837–2849. - PubMed
    1. Li C., Zheng Y., Shi Z., et al. “Perioperative Camrelizumab (C) Combined With Rivoceranib (R) and Chemotherapy (Chemo) Versus Chemo for Locally Advanced Resectable Gastric or Gastroesophageal Junction (G/GEJ) Adenocarcinoma: The First Interim Analysis of a Randomized, Phase III Trial (DRAGON IV),” Annals of Oncology 34, no. supplement S2 (2023): S852–S886.
    1. Li D., Guo X., Yang K., et al., “EpCAM‐Targeting CAR‐T Cell Immunotherapy Is Safe and Efficacious for Epithelial Tumors,” Science Advances 9, no. 48 (2023): eadg9721. - PMC - PubMed
    1. Allemani C., Matsuda T., Di Carlo V., et al., “Global Surveillance of Trends in Cancer Survival 2000–14 (CONCORD‐3): Analysis of Individual Records for 37 513 025 Patients Diagnosed With One of 18 Cancers From 322 Population‐Based Registries in 71 Countries,” Lancet 391, no. 10125 (2018): 1023–1075. - PMC - PubMed

LinkOut - more resources