Soman induces endoplasmic reticulum stress and apoptosis of cerebral organoids via the GRP78-ATF6-CHOP signaling pathway
- PMID: 40152446
- PMCID: PMC12226415
- DOI: 10.1002/2211-5463.70027
Soman induces endoplasmic reticulum stress and apoptosis of cerebral organoids via the GRP78-ATF6-CHOP signaling pathway
Abstract
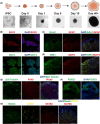
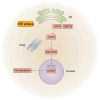
Soman is an organophosphorus compound that induces neurotoxicity. In addition to its direct toxic effects resulting from acetylcholine accumulation, neurotoxicity may also be exacerbated by inducing endoplasmic reticulum (ER) stress. In light of the current scarcity of appropriate in vitro assessment models, in the present study, we used cerebral organoids derived from human pluripotent stem cells, a new tool for investigating the mechanisms of neurotoxicity, to investigate soman-induced ER stress. The results demonstrated that soman significantly suppressed acetylcholinesterase activity and activated the GRP78-ATF6-CHOP (i.e. glucose-regulated protein 78-activating transcription factor 6-C/EBP homologous protein) ER stress cascade, driving apoptosis in cerebral organoids. Pharmacological inhibition of ER stress by pre-treating cerebral organoids with the ER stress inhibitor 4-phenylbutyric acid prior to soman exposure attenuated apoptotic signaling and downregulated GRP78, ATF6 and CHOP expression. Parallel in vivo validation utilized a rat model with subcutaneous soman exposure, focusing on hippocampal and striatal ER stress markers. Consistent with the in vitro findings, soman-exposed rats exhibited marked ER stress activation in brain regions critical for neurotoxicity. This study establishes ER stress as a key contributor to soman-induced neurotoxicity and highlights cerebral organoids as a physiologically relevant model for organophosphorus compound research. We propose ER stress modulation as a potential therapeutic strategy to mitigate neurotoxic outcomes.
Keywords: ATF6; ER stress; cerebral organoids; organophosphates; soman.
© 2025 The Author(s). FEBS Open Bio published by John Wiley & Sons Ltd on behalf of Federation of European Biochemical Societies.
Conflict of interest statement
The authors declare that they have no conflicts of interest.
Figures


Similar articles
-
Ershiwuwei Shanhu pills alleviates cerebral ischemia injury in rats by regulating endoplasmic reticulum stress through GRP78/XBP1/CHOP pathway.Phytomedicine. 2025 Sep;145:156969. doi: 10.1016/j.phymed.2025.156969. Epub 2025 Jun 10. Phytomedicine. 2025. PMID: 40532596
-
[Crosstalk between activating transcription factor 6 and the inositol-requiring enzyme 1-X-box binding protein 1 pathway in oxygen-glucose deprivation/reoxygenation-injured HT22 cells].Zhonghua Wei Zhong Bing Ji Jiu Yi Xue. 2023 Mar;35(3):278-286. doi: 10.3760/cma.j.cn121430-20230228-00115. Zhonghua Wei Zhong Bing Ji Jiu Yi Xue. 2023. PMID: 36916341 Chinese.
-
GRINA alleviates hepatic ischemia‒reperfusion injury-induced apoptosis and ER-phagy by enhancing HRD1-mediated ATF6 ubiquitination.J Hepatol. 2025 Jul;83(1):131-145. doi: 10.1016/j.jhep.2025.01.012. Epub 2025 Jan 22. J Hepatol. 2025. PMID: 39855351
-
New Hope for Pancreatic Ductal Adenocarcinoma Treatment Targeting Endoplasmic Reticulum Stress Response: A Systematic Review.Int J Mol Sci. 2018 Aug 21;19(9):2468. doi: 10.3390/ijms19092468. Int J Mol Sci. 2018. PMID: 30134550 Free PMC article.
-
Modulation of Endoplasmic Reticulum Stress in Experimental Anti-Cancer Therapy.Int J Mol Sci. 2025 Jul 3;26(13):6407. doi: 10.3390/ijms26136407. Int J Mol Sci. 2025. PMID: 40650182 Free PMC article. Review.
Cited by
-
Integrated multi-omic profiling uncovers endocannabinoid system as a driver of nerve agent-induced cognitive dysfunction in guinea pigs.Arch Toxicol. 2025 Jul 21. doi: 10.1007/s00204-025-04131-y. Online ahead of print. Arch Toxicol. 2025. PMID: 40691673
References
-
- Soltaninejad K and Shadnia S (2014) History of the use and epidemiology of organophosphorus poisoning. In Basic and Clinical Toxicology of Organophosphorus Compounds (Balali‐Mood M and Abdollahi M, eds), pp. 25–44. Springer, London.
-
- Mercey G, Verdelet T, Renou J, Kliachyna M, Baati R, Nachon F, Jean L and Renard P‐Y (2012) Reactivators of acetylcholinesterase inhibited by organophosphorus nerve agents. Acc Chem Res 45, 756–766. - PubMed
MeSH terms
Substances
LinkOut - more resources
Full Text Sources
Research Materials
Miscellaneous

