. 2025 Apr;122(13):e2411069122.
doi: 10.1073/pnas.2411069122. Epub 2025 Mar 28.

Dopaminergic neurons in the paraventricular hypothalamus extend the food consumption phase

Affiliations

Dopaminergic neurons in the paraventricular hypothalamus extend the food consumption phase

Winda Ariyani et al. Proc Natl Acad Sci U S A. 2025 Apr.

Abstract

Feeding behavior is controlled by various neural networks in the brain that are involved in different feeding phases: Food procurement, consumption, and termination. However, the specific neural circuits controlling the food consumption phase remain poorly understood. Here, we investigated the roles of dopaminergic neurons in the paraventricular nucleus of the hypothalamus (PVH) in the feeding behavior in mice. Our results indicated that the PVH dopaminergic neurons were critical for extending the food consumption phase and involved in the development of obesity through epigenetic mechanisms. These neurons synchronized with proopiomelanocortin neurons during consumption, were stimulated by proopiomelanocortin activation, and projected to the lateral habenula (LHb), where dopamine receptor D2 was involved in the increase in food consumption. In addition, upregulated tyrosine hydroxylase (TH) expression in PVH was associated with obesity and indispensable for obesity induction in mice lacking Dnmt3a. Taken together, our results highlight the roles of PVH dopaminergic neurons in promoting food consumption and obesity induction.

Keywords: DNA methylation; dopamine; food intake; hypothalamus.


Conflict of interest statement

Competing interests statement:The authors declare no competing interest.

Figures
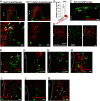
Fig. 1.
Fig. 1.
Paraventricular nucleus of the hypothalamus (PVH) tyrosine hydroxylase (TH) neurons are unique dopaminergic neurons. (A) Sim1-Cre-expressing TH neurons analyzed via TH-immunohistochemistry. TH-immunoreactive neurons (green) colocalized with tdTomato-expressing Sim1-Cre neurons (Left) in the central PVH of Sim1-Cre/tdTomato mice. This TH-immunoreactivity was abolished in the tdTomato-expressing neurons (red) of Thlox/lox/Sim1-Cre/tdTomato mice (Right). (B) Numbers of TH-immunoreactive neurons per 25-µm thick slice on one side of central PVH in control Sim1-Cre/tdTomato (control; n = 4) and Thlox/lox/Sim1-Cre (n = 3) mice. Error bar, SEM. ****P < 0.0001. (C) No Sim1-Cre-induced tdTomato expression was observed in the TH neurons (A13 dopamine group) in the posterior part of PVH (PaPo) and zona incerta (ZI) (C) in Sim1-Cre/tdTomato mice. (D) Th-Cre-expressing neurons visualized via injection of AAV-hSyn-DIO-mCherry into PVH (red) and labeling for the dopamine transporter (DAT; green). Double immunohistochemistry for TH with γ-aminobutyric acid (GABA) marker glutamic acid decarboxylase 67 (GAD67) (E), corticotropin-releasing hormone (CRH) (F), thyrotropin-releasing hormone (TRH) (G), oxytocin (H), nucleobindin 2 (NUCB2) (I), prodynorphin (J), and MC4R (K). (Scale bar, 30 μm.) Arrowheads indicate the cells exhibiting both fluorescence signals.
Fig. 2.
Fig. 2.
PVH TH neurons play an indispensable role in the epigenetic induction of obesity. (A) Body weight of Dnmt3alox/lox (n = 11 to 15), Dnmt3alox/lox/Sim1-Cre (n = 11 to 15), Dnmt3alox/lox/Thlox/lox (n = 11 to 20), and Dnmt3alox/lox/Thlox/lox/Sim1-Cre (n = 11 to 20) mice. Two-way ANOVA; main effect of group; P < 0.0001. Tukey’s multiple-comparison test; *P < 0.01, #P < 0.005, and ##P < 0.001, Dnmt3alox/lox/Sim1-Cre vs. Dnmt3alox/lox mice. (B) Body weight of Thlox/lox and Thlox/lox/Sim1-Cre mice fed a normal chow diet (n = 7 to 12/genotype) or high-fat diet (HFD; n = 6 to 7/genotype). Two-way ANOVA; main effect of group; P < 0.0001. Tukey’s multiple-comparison test; *P < 0.01, HFD-fed Thlox/lox vs. HFD-fed Thlox/lox/Sim1-Cre mice. (C) Th in situ hybridization in the PVH of mice fed chow or HFD. (D) Numbers of Th mRNA-expressing neurons in the PVH of mice fed chow (black; n = 20) and HFD (red; n = 20). (E) Th in situ hybridization in the PVH of male db/+or db/db mice at 20 wk of age. (F) Numbers of Th mRNA-expressing neurons in the PVH of db/+ (n = 5; black) and db/db (n = 7; red) mice. (Scale bar, 50 µm.) *P < 0.05 and **P < 0.01.
Fig. 3.
Fig. 3.
PVH dopaminergic neurons increase the food intake during the intermediate eating stage. (A) Intake of powdered food after 24 h of food deprivation in Thlox/lox (n = 6) and Thlox/lox/Sim1-Cre (n = 6) mice measured using the feeding, drinking, and activity monitoring system. (B) Intake of food pellets by Thlox/lox (n = 15) and Thlox/lox/Sim1-Cre (n = 10) mice from the feeder of a single-housed mouse cage. (C) TH and c-Fos double immunohistochemistry in the PVH of ad libitum fed, 25-h fasted, and 1-h refed mice. Cells expressing both TH and c-Fos are indicated by arrowheads. (D) Percentage of c-Fos-immunopositive neurons among the TH neurons in PVH [n = 6/group; one-way ANOVA (P = 0.003), Tukey’s honest significant difference (HSD) test]. *P < 0.05, **P < 0.01, and ***P < 0.005. Error bars: SEM.
Fig. 4.
Fig. 4.
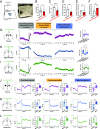
PVH dopaminergic neurons are activated during the food consumption phase. (A) 24-h food-deprived mice were placed in a rectangular open-field with a food pellet on a holder at the center and a water bottle in the corner. Mouse behavior was recorded using a video camera for 15 min. (B) Food intake of 24-h food-deprived Thlox/lox and Thlox/lox/Sim1-Cre mice was analyzed during the first 15 min. Duration of food intake (C), food contact (D), exploring (E), and walking (F) by Thlox/lox (n = 8) and Thlox/lox/Sim1-Cre (n = 10) mice. Error bar: SEM. (GL) AAV-syn-FLEX-jGCaMP8s was injected into the PVH of Th-Cre mice (G and J) and arcuate nucleus (ARC) of Agrp-Ires-Cre (H and K) and Pomc-Cre (I and L) mice. After 24-h food-deprivation, the mice were placed in an open-field for 15 min, and GCaMP intensities during feeding were determined in PVH and ARC. (GI) GCaMP intensities throughout the feeding cycle, from the food procurement and consumption phases to the meal termination phase, are shown. Z-scores were calculated for the entire feeding cycle. Trace lines with error bars (Left) indicate the average GCaMP intensity (±SEM). The onset of each phase is marked as 0 s. Mean z-score of the first 5 s of each phase was compared (Right; n = 30 trials with 10 mice; one-way ANOVA [P < 0.001 (G), P < 0.0001 (H), and P < 0.0001 (I)], Tukey’s multiple comparisons test). (JL) Change in GCaMP intensity before and after the onset (black line) of each phase is shown (n = 30 trials with 6 to 10 mice/trace line). Z-scores were calculated for the period from 5 s before to 10 s after the onset of each phase. Mean z-scores before (5 s) and after (10 s) the onset of each phase were compared (Right; n = 30). *P < 0.05, **P < 0.01, ***P < 0.005, and ****P < 0.001.
Fig. 5.
Fig. 5.
PVH dopaminergic neurons extend the food consumption phase. (A) AAV-syn-FLEX-jGCaMP8s and AAV-hSyn-DIO-hM3D(Gq)-mCherry were injected into the PVH of Th-Cre mice, and feeding behavior after saline or clozapine N-oxide (CNO) injection in 24-h fasting mice was video-recorded, along with GCaMP8s intensity measurement. (B) Representative GCaMP intensity trace lines in two mice injected with CNO. Blue color highlight indicates the duration for which the mice were in the food consumption phase. (C) Duration of the food consumption phase after the injection of saline (n = 20 mice) or CNO (n = 20 mice). (D) AAV-syn-FLEX-jGCaMP8s and AAV-hSyn-DIO-hM4D(Gi)-mCherry were injected into the PVH of Th-Cre mice, and feeding behavior after saline or CNO injection in 24-h fasting mice was video-recorded, along with GCaMP8s intensity measurement. (E) Representative GCaMP intensity trace lines in two mice injected with CNO. Blue color highlight indicates the duration for which the mice were in the food consumption phase. (F) Duration of the food consumption phase after the injection of saline (n = 14 mice) or CNO (n = 14 mice). (GI) AAV-hSyn-DIO-hM3D(Gq)-mCherry or AAV-hSyn-DIO-hM4D(Gi)-mCherry was injected into the PVH of Th-Cre mice (G), and cumulative food intake was measured in 24-h fasted mice expressing hM3D(Gq) after the injection of saline or CNO (n = 8/group; two-way ANOVA; main effect of group (P < 0.0001), Sidak’s multiple-comparison test) (H) and mice expressing hM4D(Gi) after the injection of saline or CNO (n = 8/group; two-way ANOVA; main effect of group; P < 0.0001; Sidak’s multiple-comparison test) (I). Error bar: SEM. *P < 0.05, **P < 0.01, ***P < 0.005, and ****P < 0.001.
Fig. 6.
Fig. 6.
PVH dopaminergic neurons suppress the food-seeking behavior to promote eating. (A) Operant conditioning was performed in a rectangular chamber with a touch panel LED display on one side and food dispenser on the other side, along with video recording. (B) Representative heatmap showing the duration and locations of a single mouse during the 15-min test period. (C) Average time spent in front of the LED display by Thlox/lox (n = 12) and Thlox/lox/Sim1-Cre (n = 22) mice during the 15-min test on the first day of the experiment. *P < 0.05 via Mann–Whitney test. (D and E) Time spent in the zone near the food dispenser (two-way ANOVA; main effect of group (P < 0.0001), Sidak’s multiple-comparison test) (D) and LED display (two-way ANOVA; main effect of group (P < 0.0001), Sidak’s multiple-comparison test) (E) was measured using infrared sensors for Thlox/lox (n = 13) and Thlox/lox/Sim1-Cre (n = 14) mice throughout the experimental period. (FH) Percentage of correct responses to get rewards (two-way ANOVA; main effect of group (P < 0.0001), Tukey’s multiple-comparison test) (F), latency for mice to touch the panel [two-way ANOVA; main effect of group (P = 0.7861)] (G), and latency to get reward after touching the correct touch panel [two-way ANOVA; main effect of group (P < 0.0001), Tukey’s multiple-comparison test] (H) for Thlox/lox (n = 13) and Thlox/lox/Sim1-Cre (n = 14) mice during the 15-min test. Error bar: SEM. *P < 0.05, **P < 0.01, ***P < 0.005, and ****P < 0.001.
Fig. 7.
Fig. 7.
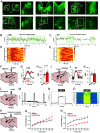
ARC POMC neurons activate the PVH dopaminergic neurons. (AC) TH immunohistochemistry (red) in the PVH of NPY-hrGFP mice. (DF) TH and POMC double immunohistochemistry in the PVH of wild-type mice. Fluorescence microscopy images at low magnification (A and D), confocal microscopy images at high magnification (B and E), and Z-stack projections of confocal microscopic images (C and F). Arrowheads indicate the conjunctions of neurons. [Scale bar, 30 µm (A and D), 5 µm (B and E), and 1 µm (C and F).] (G-M) AAV-Syn-FLEX-rc(ChrimsonR-tdTomato) was injected into the ARC and AAV-Ef1a-fDIO-GCaMP6f was injected into the PVH of Th-FLPo/Agrp-Ires-Cre or Th-FLPo/Pomc-Cre mice (G). Representative GCaMP intensity trace lines in the PVH TH neurons of Th-FLPo/Agrp-Ires-Cre (H) or Th-FLPo/Pomc-Cre (K) mice. Gray color highlight indicates 10 s of optogenetic activation of AgRP or POMC fibers in the PVH. Trace lines with error bars indicate the average GCaMP intensities (±SEM) in Th-FLPo/Agrp-Ires-Cre (n = 12 trials with 4 mice) (I) and Th-FLPo/Pomc-Cre (n = 12 trials with 4 mice) (L) mice during optogenetic activation. Heatmap showing the percentages of normalized z-scores of GCaMP6f intensity in the PVH TH neurons during the optogenetic activation of AgRP (J) and POMC fibers (M) in the PVH.
Fig. 8.
Fig. 8.
PVH dopaminergic neurons project to the lateral habenula (LHb) to extend the food consumption phase. (A) Anterograde tracer AAV-hSyn-Flex-Axon-EGFP was injected into the PVH of Th-Cre mice, and EGFP fluorescence was observed in multiple areas of the brain, including LHb, paraventricular nucleus of the thalamus (PV), periaqueductal gray (PAG), nucleus accumbens (Acb), and, basolateral amygdala (BLA), and lateral septum (LSI). Higher magnification images are shown on the Right side of each image. (Scale bar, 100 µm.) Representative trace lines of dLight1.1 intensity in mice injected with AAV-CAG-dLight1.1 into LHb (B) and PV (C) during feeding after 24-h fasting. Colored highlights indicate the duration of the food consumption phase. Heatmaps showing the percentages of the normalized z-scores of dLight1.1 intensity in LHb (D) and PV (E). The onset of food consumption is marked at 0 s (bar). (FK) AAV-hSyn-DIO-hM3D(Gq)-mCherry was injected into the PVH and AAV-CAG-dLight1.1 was injected into the LHb (F) or PV (I) of Th-Cre mice. dLight1.1 intensity was measured after saline or CNO injection in 24-h fasted mice, along with the video-recording of the feeding behavior. Trace lines with error bars indicate the average dLight1.1 intensities (±SEM) in LHb (saline: n = 30 with 6 mice; CNO: n = 30 with 6 mice) (G) and PV (saline: n = 30 with 6 mice; CNO: n = 30 with 6 mice) (J) before and after the onset (bar) of the food consumption phase. Area under the curve (AUC) of the dLight1.1 intensity trace line in LHb (saline: n = 30 with 6 mice; CNO: n = 30 with 6 mice) (H) and PV (saline: n = 30 with 6 mice; CNO: n = 30 with 6 mice) (K) during the first 5 s after the administration of saline or CNO. (LO) AAV-Syn-FLEX-rc(ChrimsonR-tdTomato) was injected into the PVH and AAV-CAG-dLight1.1 was injected into the LHb of Th-Cre mice (L). Representative trace line of dLight1.1 intensity in the LHb of Th-Cre mice is shown, with gray highlight indicating the 10-s optogenetic activation of PVH TH neurons (M). Average dLight1.1 intensity in LHb (n = 12 trials with 4 mice) during optogenetic activation (N). Heatmap showing the normalized z-scores of dLight1.1 intensity in LHb neurons during the optogenetic activation of PVH TH neurons (O). (P and R) AAV-hSyn-DIO-hM3D(Gq)-mCherry was injected into the PVH of Th-Cre mice, and a guide cannula was implanted into LHb (P). Saline or dopamine receptor D1 antagonist SCH23390 (0.2 µg; saline: n = 11; SCH23390: n = 5; two-way ANOVA; main effect of group; P = 0.1785) (Q), or dopamine receptor D2 antagonist raclopride (0.3 µg; saline: n = 11; raclopride: n = 5; two-way ANOVA; main effect of group (P < 0.0001), Sidak’s multiple-comparison test) (R) was injected into LHb before the intraperitoneal injection of CNO. Cumulative food intake was subsequently quantified. Error bar: SEM. *P < 0.05, **P < 0.01, and ****P < 0.001.

Comment in

References

    1. Collaboration NCDRF, Worldwide trends in body-mass index, underweight, overweight, and obesity from 1975 to 2016: A pooled analysis of 2416 population-based measurement studies in 128.9 million children, adolescents, and adults. Lancet 390, 2627–2642 (2017). - PMC - PubMed
    1. Schwartz M. W., et al. , Obesity pathogenesis: An endocrine society scientific statement. Endocr. Rev. 38, 267–296 (2017). - PMC - PubMed
    1. Barsh G. S., Schwartz M. W., Genetic approaches to studying energy balance: Perception and integration. Nat. Rev. Genet 3, 589–600 (2002). - PubMed
    1. Li M. M., et al. , The paraventricular hypothalamus regulates satiety and prevents obesity via two genetically distinct circuits. Neuron 102, 653–667.e656 (2019). - PMC - PubMed
    1. Xu S., et al. , Behavioral state coding by molecularly defined paraventricular hypothalamic cell type ensembles. Science 370, eabb2494 (2020). - PMC - PubMed

MeSH terms

LinkOut - more resources