. 2025 Mar 28;11(13):eadp8271.
doi: 10.1126/sciadv.adp8271. Epub 2025 Mar 28.

Perturbed cell fate decision by schizophrenia-associated AS3MTd2d3 isoform during corticogenesis

Affiliations

Perturbed cell fate decision by schizophrenia-associated AS3MTd2d3 isoform during corticogenesis

Seunghyun Kim et al. Sci Adv. .

Abstract

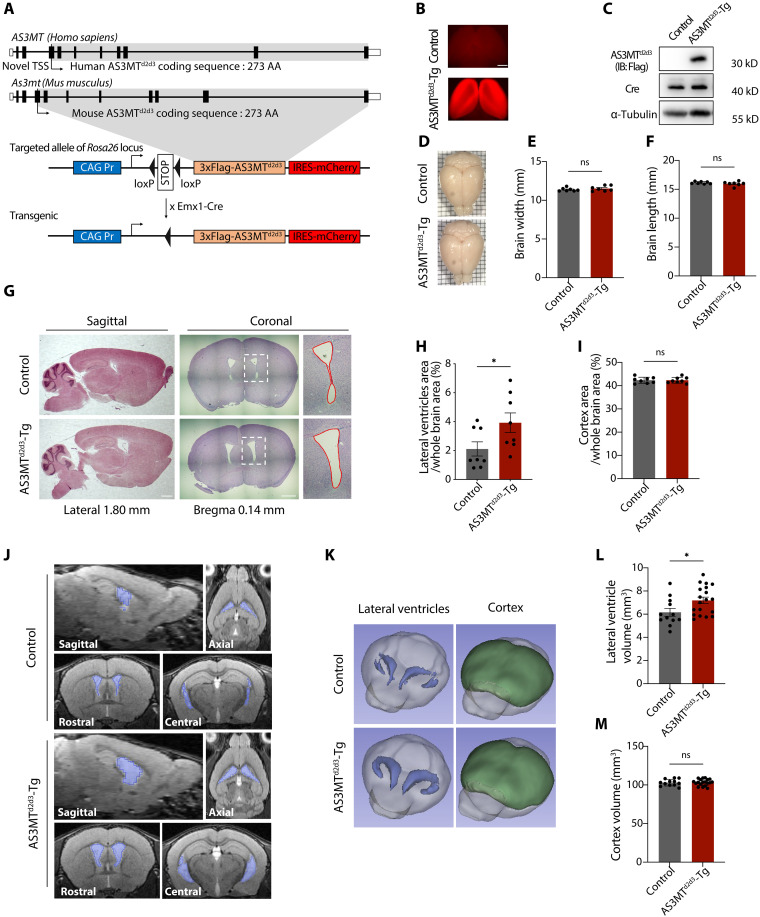
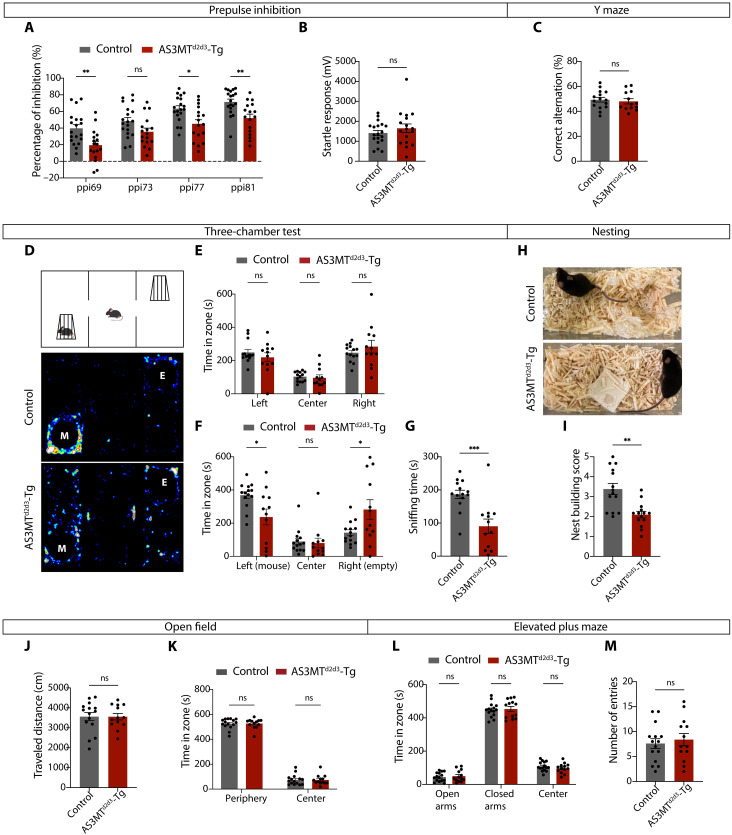
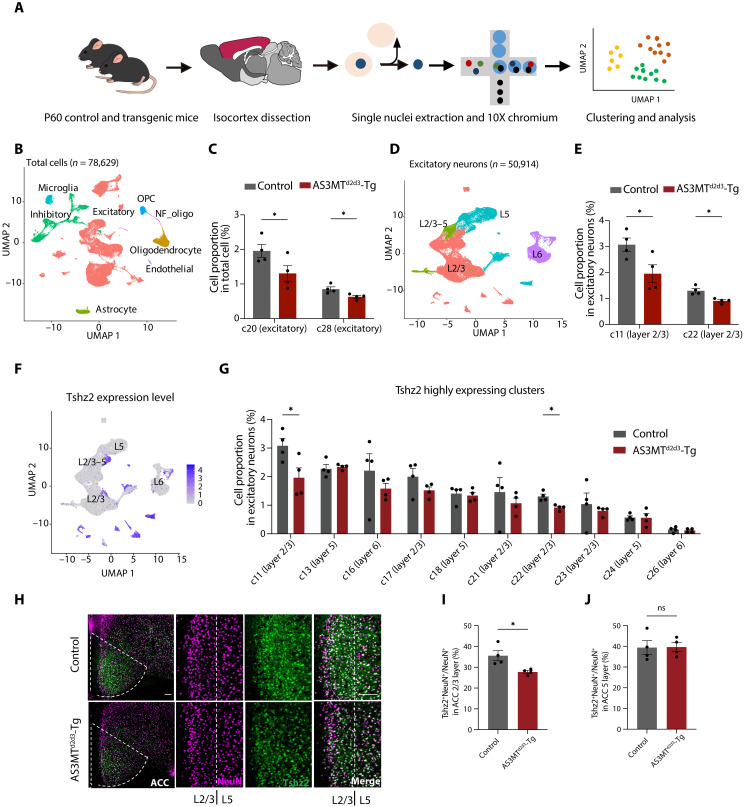
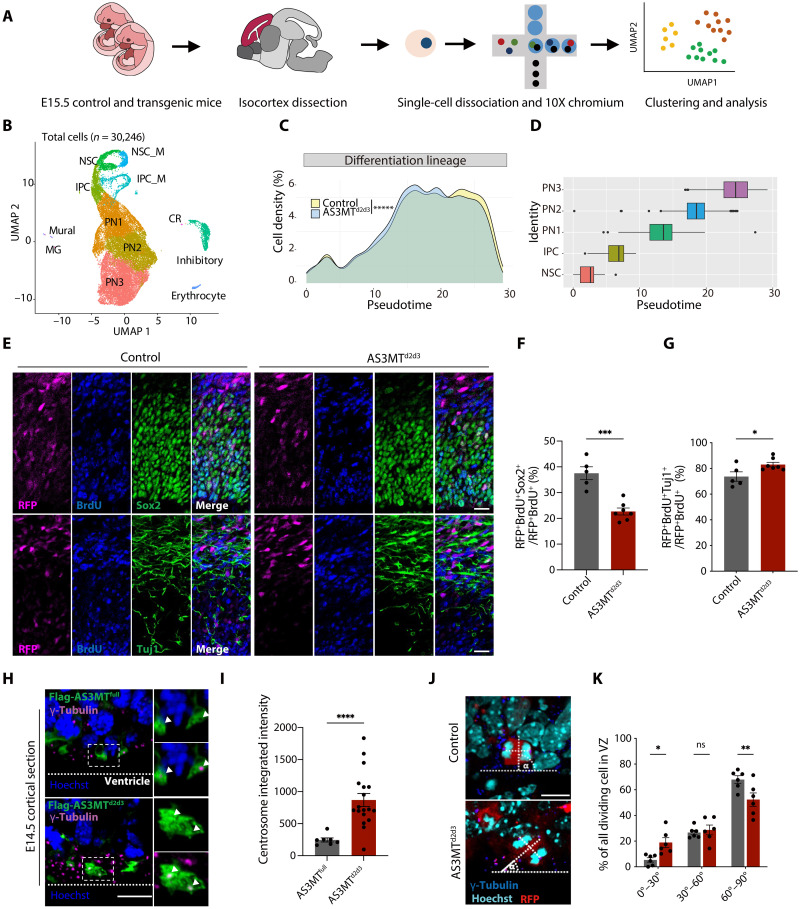
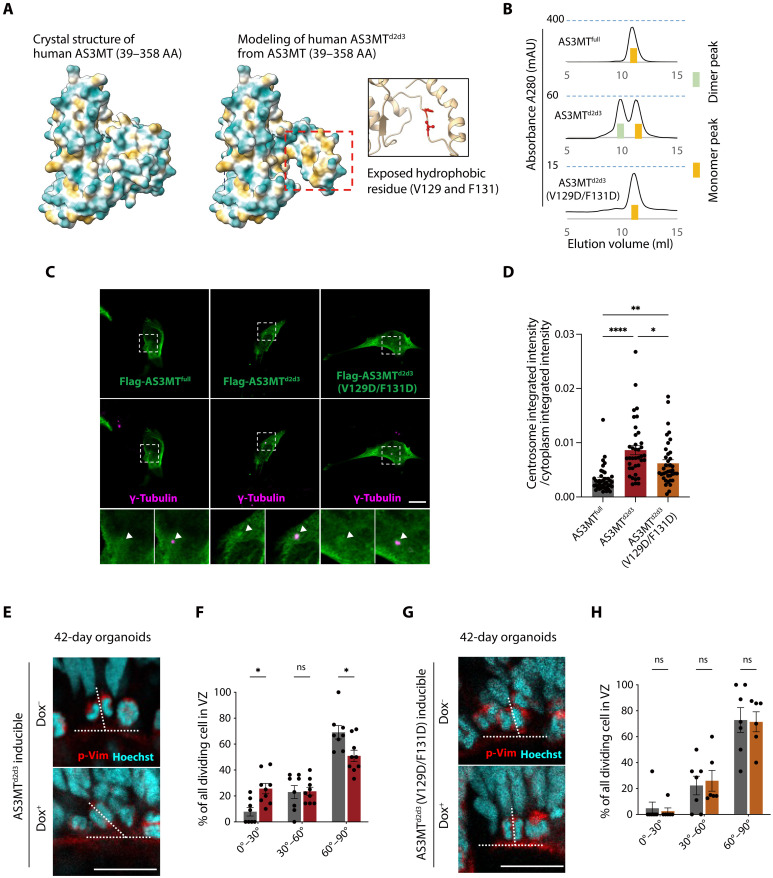
The neurodevelopmental theory of schizophrenia emphasizes early brain development in its etiology. Genome-wide association studies have linked schizophrenia to genetic variations of AS3MT (arsenite methyltransferase) gene, particularly the increased expression of AS3MTd2d3 isoform. To investigate the biological basis of this association with schizophrenia pathophysiology, we established a transgenic mouse model (AS3MTd2d3-Tg) ectopically expressing AS3MTd2d3 at the cortical neural stem cells. AS3MTd2d3-Tg mice exhibited enlarged ventricles and deficits in sensorimotor gating and sociability. Single-cell and single-nucleus RNA sequencing analyses of AS3MTd2d3-Tg brains revealed cell fate imbalances and altered excitatory neuron composition. AS3MTd2d3 localized to centrosome, disrupting mitotic spindle orientation and differentiation in developing neocortex and organoids, in part through NPM1 (Nucleophosmin 1). The structural analysis identified that hydrophobic residues exposed in AS3MTd2d3 are critical for its pathogenic function. Therefore, our findings may help to explain the early pathological features of schizophrenia.


Figures

Fig. 1.
Fig. 1.. AS3MTd2d3-Tg mice display ventricle enlargement.
(A) Schematic diagrams of the AS3MT and As3mt genomic region and the Cre-dependent mouse AS3MTd2d3 and reporter gene expression construct at the Rosa26 locus in the transgenic mice. Gray areas represent AS3MTd2d3 coding regions. (B) Fluorescence images of E14.5 embryonic cortex from control and AS3MTd2d3-Tg mouse. (C) Western blot from control and AS3MTd2d3-Tg embryonic brains. (D) P60 brains from control and AS3MTd2d3-Tg mouse on the 1-mm2 paper. (E and F) Quantification of brain width and length (Control, n = 7; AS3MTd2d3-Tg, n = 7). (G) Hematoxylin and eosin staining from littermate control and AS3MTd2d3-Tg mouse brains at the coordinate lateral (1.80 mm) and (bregma 0.14 mm). (H and I) Quantification of the percentage of lateral ventricle or cortex area at the coronal section (Control, n = 8; AS3MTd2d3-Tg, n = 8). (J) Slices from littermate control and AS3MTd2d3-Tg mice brain MRIs. (K) Volumetric views of the lateral ventricles and cortex. (L and M) Quantification of lateral ventricle and cortex volume (Control, n = 12; AS3MTd2d3-Tg, n = 19). Scale bars, (B) 500 μm and (B) 1 mm. Bar graphs show means ± SEM. Statistical significance is defined by unpaired two-tailed t tests; *P < 0.05. TSS, translation start site; AA, amino acids; ns, not significant.
Fig. 2.
Fig. 2.. AS3MTd2d3-Tg mice exhibit SZ-associated behavioral deficits.
(A) Quantification of the percentage of PPI to a prepulse of 69, 73, 77, and 81 dB (Control, n = 19; AS3MTd2d3-Tg, n = 17). (B) Quantification of the startle response (Control, n = 19; AS3MTd2d3-Tg, n = 17). (C) Quantification of the percentage of correct alternation in the Y-maze test (Control, n = 15; AS3MTd2d3-Tg, n = 13). (D) Map of the chambers (left with mice in a cage “M,” center, and right with an empty cage “E”) and heatmaps during the test period. (E) Quantification of time spent during the habituation period (Control, n = 14; AS3MTd2d3-Tg, n = 12). (F) Quantification of time spent during the test period (Control, n = 14; AS3MTd2d3-Tg, n = 12). (G) Quantification of sniffing time spent interacting with a mouse (Control, n = 14; AS3MTd2d3-Tg, n = 12). (H) Images of the nesting behavior. (I) Quantification of the nest building score (Control, n = 14; AS3MTd2d3-Tg, n = 14). (J) Quantification of traveled distance (Control, n = 15; AS3MTd2d3-Tg, n = 13). (K) Quantification of time spent in the center and periphery (Control, n = 15; AS3MTd2d3-Tg, n = 13). (L) Quantification of time spent in open arms, closed arms, and center (Control, n = 15; AS3MTd2d3-Tg, n = 13). (M) Quantification of the number of entries (Control, n = 15; AS3MTd2d3-Tg, n = 13). Bar graphs show the means ± SEM. Statistical significance is defined by unpaired two-tailed t tests for two groups except nesting behavior (Mann Whitney test) and two-way analysis of variance (ANOVA) with Bonferroni’s post hoc test for comparisons among multiple groups; *P < 0.05; **P < 0.01; ***P < 0.001.
Fig. 3.
Fig. 3.. AS3MTd2d3-Tg mice brain harbors altered excitatory neuron composition.
(A) Overview of the experimental approach. Nuclei of cortical cells were isolated from P60 littermate control or AS3MTd2d3-Tg mice across four biological replicates. (B) Uniform Manifold Approximation and Projection (UMAP) embedding of integrated snRNA-seq cell type annotation from total cells (n = 78,629). (C) Statistically significant clusters from proportion analysis of total cells (c20 and c28). (D) UMAP embedding of integrated snRNA-seq cell type annotation from excitatory neurons (n = 50,914). (E) Statistically significant clusters from proportion analysis of excitatory neurons (c11 and c22). (F) Tshz2 expression level in UMAP plot from excitatory neuron. (G) Tshz2-high expression clusters from proportion analysis of excitatory neurons. (H) Brain sections stained with antibodies against Tshz2 and NeuN in control and AS3MTd2d3-Tg mice. The dotted line indicates the ACC (left) and the layer boundary (right). (I and J) Quantification of the Tshz2+NeuN+ cells among NeuN+ cells in layer 2/3 or layer 5 (Control, n = 4; AS3MTd2d3-Tg, n = 4). Scale bars, 100 μm. Bar graphs show the means ± SEM. Statistical significance is defined by moderate t test for snRNA-seq analysis and unpaired two-tailed t tests for immunostaining analysis; *P < 0.05. OPC, oligodendrocyte progenitor cell; NF_oligo, newly formed oligodendrocyte; ACC, anterior cingulate cortex.
Fig. 4.
Fig. 4.. AS3MTd2d3 expression perturbs NSC fate and spindle orientation with evidence of centrosome localization.
(A) Overview of the experimental approach. Cortical cells were isolated from E15.5 littermate control or AS3MTd2d3-Tg mice across two biological replicates. (B) UMAP embedding of integrated scRNA-seq cell type annotation (n = 30,246). (C and D) Trajectory inference and pseudo-time analysis between control and AS3MTd2d3-Tg. (E) E15.5 brain sections stained as indicated. in utero electroporation at E13.5 and BrdU injection at E14.5. (F and G) Quantification of the percentage of RFP+BrdU+Sox2+ or RFP+BrdU+Tuj1+ cells among the RFP+BrdU+ cells (Control, n = 5; AS3MTd2d3, n = 7). (H) Subcellular localization of Flag-AS3MTfull or Flag-AS3MTd2d3 in E14.5 brain sections, stained as indicated. (I) Quantification of the centrosome integrated intensity marked by γ-tubulin (AS3MTfull, n = 7; AS3MTd2d3, n = 18). (J) E14.5 brain sections stained as indicated. in utero electroporation at E13.5. Dotted line indicates orientation of the sister chromatids (α). (K) Quantification of the percentage of cortical progenitors within each 30° interval (Control, n = 6; AS3MTd2d3, n = 6). Scale bars, (E) 20 μm and [(H) and (J)] 10 μm. Bar graphs show the means ± SEM. Statistical significance is defined by unpaired two-tailed t tests for Sox2 and Tuj1 staining analysis, Welch’s t test for centrosome staining analysis, Kolmogorov-Smirnov test for trajectory analysis, and two-way ANOVA with Bonferroni’s post hoc test for comparisons among multiple groups; *P < 0.05; **P < 0.01; ***P < 0.001; ****P < 0.0001; *****P < 0.00001. NSC, neural stem cell; NSC_M, NSC in mitosis; IPC, intermediate progenitor cell; IPC_M, IPC in mitosis; PN, projection neuron; MG, microglia; CR, Cajal-Retzius; VZ, ventricular zone.
Fig. 5.
Fig. 5.. Exposed hydrophobic residues of AS3MTd2d3 drive centrosome localization and spindle misorientation.
(A) Human AS3MT protein structure (39 to 358 AA) and deletion model (AS3MTd2d3) with surface analysis (hydrophobic residues, yellow; hydrophilic residues, blue). (B) 75S size exclusion chromatography [top, AS3MTfull; middle, AS3MTd2d3; bottom, AS3MTd2d3 (V129D/F131D)]. (C) Representative image of the subcellular localization of Flag-AS3MTfull, Flag-AS3MTd2d3, or Flag-AS3MTd2d3 (V129D/F131D) in HEK293FT cell line, stained as indicated. The arrowheads indicate centrosome site in magnified images. (D) Quantification of the centrosome-integrated intensity divided by cytoplasm-integrated intensity [AS3MTfull, n = 39; AS3MTd2d3, n = 38; AS3MTd2d3 (V129D/F131D), n = 38]. (E) Representative images of the mitotic cell with a dividing plane from 42-day AS3MTd2d3 inducible organoids. (F) Percentage of cortical progenitors within each 30° interval (not treated #1 line, n = 8; doxycycline-treated #1 line, n = 9). (G) Representative images of the mitotic cell with a dividing plane from 42-day AS3MTd2d3 (V129D/F131D) inducible organoids. (H) Percentage of cortical progenitors within each 30° interval (not treated #10 line, n = 7; doxycycline-treated #10 line, n = 6). Scale bars, (C) 10 μm and [(E) and (G)] 20 μm. Bar graphs show the means ± SEM. Statistical significance is defined by one-way ANOVA for centrosome localization analysis and two-way ANOVA for spindle orientation analysis with Bonferroni’s post hoc test for comparisons among multiple groups; *P < 0.05; **P < 0.01; ****P < 0.0001. Dox, doxycycline.

Similar articles

References

    1. Birnbaum R., Weinberger D. R., Genetic insights into the neurodevelopmental origins of schizophrenia. Nat. Rev. Neurosci. 18, 727–740 (2017). - PubMed
    1. Shenton M. E., Dickey C. C., Frumin M., McCarley R. W., A review of MRI findings in schizophrenia. Schizophr. Res. 49, 1–52 (2001). - PMC - PubMed
    1. Aghevli M. A., Blanchard J. J., Horan W. P., The expression and experience of emotion in schizophrenia: A study of social interactions. Psychiatry Res. 119, 261–270 (2003). - PubMed
    1. Mata I., Perez-Iglesias R., Roiz-Santiañez R., Tordesillas-Gutierrez D., Gonzalez-Mandly A., Berja A., Vazquez-Barquero J. L., Crespo-Facorro B., Additive effect of NRG1 and DISC1 genes on lateral ventricle enlargement in first episode schizophrenia. Neuroimage 53, 1016–1022 (2010). - PubMed
    1. Ripke S., O’Dushlaine C., Chambert K., Moran J. L., Kähler A. K., Akterin S., Bergen S. E., Collins A. L., Crowley J. J., Fromer M., Kim Y., Lee S. H., Magnusson P. K. E., Sanchez N., Stahl E. A., Williams S., Wray N. R., Xia K., Bettella F., Borglum A. D., Bulik-Sullivan B. K., Cormican P., Craddock N., de Leeuw C., Durmishi N., Gill M., Golimbet V., Hamshere M. L., Holmans P., Hougaard D. M., Kendler K. S., Lin K., Morris D. W., Mors O., Mortensen P. B., Neale B. M., O’Neill F. A., Owen M. J., Milovancevic M. P., Posthuma D., Powell J., Richards A. L., Riley B. P., Ruderfer D., Rujescu D., Sigurdsson E., Silagadze T., Smit A. B., Stefansson H., Steinberg S., Suvisaari J., Tosato S., Verhage M., Walters J. T., Multicenter Genetic Studies of Schizophrenia Consortium, Levinson D. F., Gejman P. V., Kendler K. S., Laurent C., Mowry B. J., O’Donovan M. C., Owen M. J., Pulver A. E., Riley B. P., Schwab S. G., Wildenauer D. B., Dudbridge F., Holmans P., Shi J., Albus M., Alexander M., Campion D., Cohen D., Dikeos D., Duan J., Eichhammer P., Godard S., Hansen M., Lerer F. B., Liang K.-Y., Maier W., Mallet J., Nertney D. A., Nestadt G., Norton N., O’Neill F. A., Papadimitriou G. N., Ribble R., Sanders A. R., Silverman J. M., Walsh D., Williams N. M., Wormley B., Psychosis Endophenotypes International Consortium, Arranz M. J., Bakker S., Bender S., Bramon E., Collier D., Crespo-Facorro B., Hall J., Iyegbe C., Jablensky A., Kahn R. S., Kalaydjieva L., Lawrie S., Lewis C. M., Lin K., Linszen D. H., Mata I., Intosh A. M., Murray R. M., Ophoff R. A., Powell J., Rujescu D., Van Os J., Walshe M., Weisbrod M., Wiersma D., Wellcome Trust Case Control Consortium 2, Donnelly P., Barroso I., Blackwell J. M., Bramon E., Brown M. A., Casas J. P., Corvin A. P., Deloukas P., Duncanson A., Jankowski J., Markus H. S., Mathew C. G., Palmer C. N. A., Plomin R., Rautanen A., Sawcer S. J., Trembath R. C., Viswanathan A. C., Wood N. W., Spencer C. C. A., Band G., Bellenguez C., Freeman C., Hellenthal G., Giannoulatou E., Pirinen M., Pearson R. D., Strange A., Su Z., Vukcevic D., Donnelly P., Langford C., Hunt S. E., Edkins S., Gwilliam R., Blackburn H., Bumpstead S. J., Dronov S., Gillman M., Gray E., Hammond N., Jayakumar A., Cann O. T. M., Liddle J., Potter S. C., Ravindrarajah R., Ricketts M., Tashakkori-Ghanbaria A., Waller M. J., Weston P., Widaa S., Whittaker P., Barroso I., Deloukas P., Mathew C. G., Blackwell J. M., Brown M. A., Corvin A. P., McCarthy M. I., Spencer C. C. A., Bramon E., Corvin A. P., O’Donovan M. C., Stefansson K., Scolnick E., Purcell S., McCarroll S. A., Sklar P., Hultman C. M., Sullivan P. F., Genome-wide association analysis identifies 13 new risk loci for schizophrenia. Nat. Genet. 45, 1150–1159 (2013). - PMC - PubMed