. 2025 Mar 18;135(10):e181164.
doi: 10.1172/JCI181164. eCollection 2025 May 15.

Loss of GalNAc-T14 links O-glycosylation defects to alterations in B cell homing in IgA nephropathy

Affiliations

Loss of GalNAc-T14 links O-glycosylation defects to alterations in B cell homing in IgA nephropathy

Sindhuri Prakash et al. J Clin Invest. .

Abstract

Aberrant O-glycosylation of the IgA1 hinge region is a characteristic finding in patients with IgA nephropathy (IgAN) and is thought to contribute to immune-complex formation and kidney injury. Other studies have suggested that abnormalities in mucosal immunity and lymphocyte homing are major contributors to disease. We identified a family with IgAN segregating a heterozygous predicted loss-of-function (LOF) variant in GALNT14, the gene encoding N-acetylgalactosaminyltransferase 14, one of the enzymes involved in mucin-type protein O-glycosylation. While GALNT14 is expressed in IgA1-producing cells, carriers of the LOF variant did not have altered levels of poorly glycosylated IgA1, suggesting other disease mechanisms. Investigation of Galnt14-null mice revealed elevated serum IgA levels and ex vivo IgA production by B cells. These mice developed glomerular IgA deposition with aging and after induction of sterile colitis. Galnt14-null mice also displayed an attenuated mucin layer in the colon and redistribution of IgA-producing cells from mucosal to systemic sites. Adoptive-transfer experiments indicated impaired homing of spleen-derived Galnt14-deficient B lymphocytes, resulting in increased retention in peripheral blood. These findings suggest that abnormalities in O-glycosylation alter mucosal immunity and B lymphocyte homing, pointing to an expanded role of aberrant O-glycosylation in the pathogenesis of IgAN.

Keywords: Genetic diseases; Genetics; Glycobiology; Immunoglobulins; Nephrology.


Figures

Figure 1
Figure 1. Genetic variation of GALNT14 in familial IgAN and expression in lymphoid tissues.
(A) A pedigree with 2 individuals with biopsy-proven IgAN (individuals with corresponding phenotype are indicated). Exome sequencing was performed in individuals with an asterisk (*) (the proband and his mother). Genome-wide genotyping was performed on all individuals with available DNA, denoted by red circles. Individuals carrying the GALNT14 nonsense variant are denoted by a fully filled-in red dot, confirmed by Sanger sequencing. (B) Logarithm of odds (LOD) score plot for parametric linkage analysis under the autosomal dominant model with incomplete penetrance revealed 7 top signals (totaling about 2.4% of the genome) harboring about 1,800 genes, including the nonsense variant (p.R315X) found in GALNT14. (C) Confirmatory Sanger sequencing was done in all individuals with available DNA. Representative chromatograms are shown here with corresponding amino acid sequence. (D) No differences in the total IgA serum levels between the variant carriers and noncarriers (denoted as reference). (E) No differences in Gd-IgA1 levels between carriers and noncarriers of the p.R315X variant. (F) Sanger sequencing of sporadic IgAN cases of revealed an additional patient with a nonsense variant resulting in a premature termination of translation (representative chromatogram and amino acid sequence is shown). (G) IHC of GalNAc-T14 in the human spleen (n = 1), (H) human lymph node (n = 1), (I) human kidney cortex (n = 1). (J) human kidney medulla (n = 1). (K) human proximal and distal tubules of the kidney (n = 1). (L) Human kidney glomerulus (n = 1), (M) Comparison of the expression of different N-acetylgalactosaminyltransferases in immortalized IgA1-secreting cell lines demonstrates elevated expression of GALNT14 in the cells derived from the peripheral blood of patients with IgAN (n = 4) compared with those from healthy individuals (n = 4) (*P = 0.006). Original magnification, ×200 (G and H), ×400 (IL).
Figure 2
Figure 2. Elevated IgA in the serum and deposition of IgA in the kidneys of Galnt14-null mice.
(A) Serum IgA levels were significantly elevated in Galnt14–/– mice (n = 11, 6 male and 5 female) compared with Galnt14+/+ mice (n = 17, 10 male and 7 female), unpaired t test, ****P < 0.001. No difference was observed in the IgG serum concentrations. (B) Histological analysis of the colon reveals the mucin levels are reduced in the Galnt14–/– mice (n = 3) compared with the Galnt14+/+ mice (n = 4). Mucin was measured at 3 points across the colon of Galnt14+/+ mice (15.9 + 2.6 μm) and Galnt14–/– mice (3.2 + 0.39 μm, Supplemental Figure 5). (C) Mesangial IgA deposition was observed more frequently in Galnt14-null mice aged 8–12 months (n = 17, 11 male and 6 female) compared with the heterozygous and WT littermate mice (n = 14, 9 male and 5 female, and n = 14, 10 male and 4 female, respectively). (D) The DSS-treated Galnt14-null mice (aged 3 months) more frequently displayed mesangial IgA deposits (n = 11, 6 male and 5 female) compared with the DSS-treated heterozygous and WT littermates (n = 4, 2 male and 2 female, and n = 11, 8 male and 3 female, respectively), or water-treated mice (Galnt14–/– mice, n = 11, 5 male and 6 female; Galnt14+/– mice, n = 5, 1 male and 4 female; Galnt14+/+ mice n = 9, 6 male and 3 female). Original magnification, ×600 (C and D).
Figure 3
Figure 3. Elevated IgA concentrations in the mucosal compartments of Galnt14–/– mice.
(A) Increased IgA in the peritoneal cavity in Galnt14–/– mice (n = 11, 6 male and 5 female) compared to Galnt14+/+ mice (n = 17, 10 male and 7 female) (B) Increased (of IgA bound to bacteria in the small intestine of the Galnt14–/– mice (n = 8, 4 male and 4 female) compared to the Galnt14+/+ mice (n = 15, 9 male and 6 female). (C) no difference in the ‘free’ IgA in the small intestine, (D), increased IgA bound to fecal bacteria in the colons, (E) increased free IgA in the colons the Galnt14–/– mice (n = 11, 6 male and 5 female) compared to the Galnt14+/+ mice (n = 17, 10 male and 7 female). (F) Flow cytometric analysis identifying the fecal bacteria in Galnt14+/+ mice and (G) Galnt14–/– mice, (H) IgA bound to fecal bacteria in Galnt14+/+ mice, and (I) Galnt14–/– mice. (J) Increased percentage of fecal bacteria identified as IgA high/positive in Galnt14–/– mice and (K) in Galnt14–/– mice. Mouse numbers: Galnt14+/+ mice (n = 7, 4 male and 3 female) and Galnt14–/– mice (n = 6, 3 male and 3 female). (L) In ex vivo cultures, splenic lymphocytes from Galnt14–/– mice (n = 8, 4 male and 4 female) secreted significantly more IgA into the supernatant compared with splenic lymphocytes from Galnt14+/+ mice (n = 15, 9 male and 6 female). (M) In ex vivo cultures of peritoneal lymphocytes, no genotype differences in the amounts of IgA secreted into the supernatant; Galnt14–/– mice (n = 8, 4 male and 4 female) and Galnt14+/+ mice (n = 14, 8 male and 6 female). All comparisons are based on unpaired t test. *P < 0.05, **P < 0.01, ***P < 0.005, and ****P < 0.001.
Figure 4
Figure 4. Microbiome analysis of the fecal pellets and the small intestine demonstrates no differences between the Galnt14–/– mice and Galnt14+/+ mice.
(A) α diversity comparisons (Chao1) of the fecal pellets and the small intestine revealed no differences between the Galnt14+/+ mice and Galnt14–/– mice. (B) Principal Coordinates Analysis (PCoA) of microbial community composition across Galnt14+/+ mice and Galnt14–/– mice, faceted by Fecal and Small Intestine (SI) Pellets using Bray-Curtis plots, demonstrated no differences in the β diversity. (C) Bacterial abundance heatmap of the fecal pellets in the Galnt14+/+ mice and Galnt14–/– mice. (D) Bacterial abundance heatmap of the small intestine in the Galnt14+/+ mice and Galnt14–/– mice. In all analyses, 16 Galnt14+/+ mice (9 male and 7 female) and 19 Galnt14–/– mice (12 male and 7 female).
Figure 5
Figure 5. Analysis of IgA B cells in tissues of mice.
(A) Gating strategy to identify the CD3, CD14, CD19+, IgD, IgA+ B cells. (B) Increased serum levels of IgA, (C) no differences in serum IgG, (D) no differences in serum sIgA, (E) increased polymeric serum IgA, (F) A significant positive correlation was observed between serum polymeric IgA and IgA between the genotypes (P = 0.001, Pearson 2-tailed test, Galnt14–/– mice (n = 13, 6 male and 7 female) and Galnt14+/+ mice (n = 13, 7 male and 6 female)). (G) A significant increase in the percentage and number of IgA+ B cells in the circulation of Galnt14–/– mice (n = 13, 6 male and 7 female) compared with Galnt14+/+ mice (n = 13, 7 male and 6 female); (H) the percentage and number of IgA+ B cells in the spleen of Galnt14–/– mice (n = 17, 9 male and 8 female) compared with Galnt14+/+ mice (n = 13, 7 male and 6 female); (I) the percentage and number of IgA+ B cells in the peritoneal cavity of Galnt14–/– mice (n = 17, 9 male and 8 female) compared with Galnt14+/+ mice (n = 15, 8 male and 7 female). (J) A significant decrease in the percentage and number of IgA+ B cells in the PPs of Galnt14–/– mice (n = 13, 6 male and 7 female) compared with Galnt14+/+ mice (n = 14, 7 male and 7 female). (K) A significant positive correlation of the number of IgA+ cells in the circulation with serum IgA levels (P = 0.0001, Pearson 2-tailed test). (L) A significant negative correlation of the number of IgA+ cells in the PP with serum IgA levels (P = 0.0002, Pearson 2-tailed test). *P < 0.05, **P < 0.01, ***P < 0.005, and ****P < 0.001, by an unpaired t test.
Figure 6
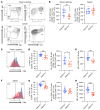
Figure 6. Analysis of PNA staining on the germinal center B cells in the Payer’s patches and spleens of Galnt14+/+ and Galnt14–/– mice.
(A) Identification of the GC B cells (CD19+, IgM, IgG, CD95+, and GL7+) in the PPs (top) and spleens (bottom). (B) A significant difference in the number of GC B cells was observed in the PPs of Galnt14–/– mice compared with Galnt14+/+ mice (P < 0.01, unpaired t test). (C) Histogram plots of PNA staining of GC B cells in the PPs. (D) A significant difference in the percentage and number of PNA+ GC B cells was observed in the PPs of Galnt14–/– mice compared with Galnt14+/+ mice (P < 0.01, unpaired t test) (E) A significant difference in the MFI of PNA+ staining on the GC B cells was observed in the PP of Galnt14–/– mice compared with Galnt14+/+ mice (P < 0.01, unpaired t test (F) Histogram plots of PNA staining of GC B cells in the spleen of Galnt14–/– mice and Galnt14+/+ mice. (G) No difference in the number of PNA+ GC B cells was observed in the spleen; however, a significant difference in the percentage PNA+ GC B cells was observed in the spleen of Galnt14–/– mice compared with Galnt14+/+ mice (P < 0.01, unpaired t test) (H) A significant difference in the MFI of PNA+ staining on the GC B cells was observed in the spleens of Galnt14–/– mice compared with Galnt14+/+ mice (P < 0.01, unpaired t test). For PP assessment, n = 12 (6 male and 6 female) of Galnt14+/+ mice and n= 10 (5 male and 5 female) of Galnt14–/– mice. For spleen assessment, n = 13 (7 male and 6 female) for Galnt14+/+ mice and n = 15 (8 male and 7 female) for Galnt14–/– mice. *P < 0.05, **P < 0.01, ***P < 0.005, and ****P < 0.001.
Figure 7
Figure 7. Adoptive transfer of lymphocytes from Galnt14–/– mice demonstrates a deficiency in the homing ability of B cells.
(A) Schematic of the adoptive transfer experiment. (B) Identification of the adoptively transferred B cells in the spleen and the peripheral blood of the recipient mice. (C) Adoptive transfer of 3.5 × 10⁶ lymphocytes derived from Galnt14–/– mice had significantly less (P < 0.01, unpaired t test) CD19+ B cells identified in the spleens of the recipient mice (Galnt14+/+ or Galnt14–/–, n = 5 per group, 2 male and 3 female) compared with adoptively transferred lymphocytes derived from Galnt14+/+ mice into recipient mice (Galnt14+/+ or Galnt14–/–, n = 5 per group). (D) Adoptive transfer of 3.5 × 10⁶ lymphocytes derived from Galnt14–/– mice had increased (P < 0.01) CD19+ B cells identified in the PBMC of the recipient mice (Galnt14+/+ or Galnt14–/–, n = 5 per group) compared with adoptively transferred lymphocytes derived from Galnt14+/+ mice into the recipient mice (Galnt14+/+ or Galnt14–/–, n = 5 per group, 2 male and 3 female).

Comment in

  • GALNT14 deficiency: connecting multiple links in the IgA nephropathy pathogenetic chain

References

    1. Reily C, et al. Glycosylation in health and disease. Nat Rev Nephrol. 2019;15(6):346–366. doi: 10.1038/s41581-019-0129-4. - DOI - PMC - PubMed
    1. Hsu JM, et al. Posttranslational modifications of PD-L1 and their applications in cancer therapy. Cancer Res. 2018;78(22):6349–6353. doi: 10.1158/0008-5472.CAN-18-1892. - DOI - PMC - PubMed
    1. Zhou X, et al. Antibody glycosylation in autoimmune diseases. Autoimmun Rev. 2021;20(5):102804. doi: 10.1016/j.autrev.2021.102804. - DOI - PMC - PubMed
    1. Holleboom AG, et al. Heterozygosity for a loss-of-function mutation in GALNT2 improves plasma triglyceride clearance in man. Cell Metab. 2011;14(6):811–818. doi: 10.1016/j.cmet.2011.11.005. - DOI - PMC - PubMed
    1. Pitcher D, et al. Long-term outcomes in IgA nephropathy. Clin J Am Soc Nephrol. 2023;18(6):727–738. doi: 10.2215/CJN.0000000000000135. - DOI - PMC - PubMed

MeSH terms

Substances