. 2025 Apr;14(4):e70035.
doi: 10.1002/jev2.70035.

Direct delivery of immune modulators to tumour-infiltrating lymphocytes using engineered extracellular vesicles

Affiliations

Direct delivery of immune modulators to tumour-infiltrating lymphocytes using engineered extracellular vesicles

Xiabing Lyu et al. J Extracell Vesicles. 2025 Apr.

Abstract

Extracellular vesicles (EVs) are important mediators of cell-cell communication, including immune regulation. Despite the recent development of several EV-based cancer immunotherapies, their clinical efficacy remains limited. Here, we created antigen-presenting EVs to express peptide-major histocompatibility complex (pMHC) class I, costimulatory molecule and IL-2. This enabled the selective delivery of multiple immune modulators to antigen-specific CD8+ T cells, promoting their expansion in vivo without severe adverse effects. Notably, antigen-presenting EVs accumulated in the tumour microenvironment, increasing IFN-γ+ CD8+ T cell and decreasing exhausted CD8+ T cell numbers, suggesting that antigen-presenting EVs transformed the 'cold' tumour microenvironment into a 'hot' one. Combination therapy with antigen-presenting EVs and anti-PD-1 demonstrated enhanced anticancer immunity against established tumours. We successfully engineered humanized antigen-presenting EVs, which selectively stimulated tumour antigen-specific CD8+ T cells. In conclusion, engineering EVs to co-express multiple immunomodulators represents a promising method for cancer immunotherapy.

Keywords: antigen presentation; cancer immunotherapy; drug delivery; extracellular vesicle; targeted cytokine delivery.


Conflict of interest statement

R.H., T.Y., and K.M. applied for a patent (WO2021172595) on antigen‐presenting extracellular vesicles. Other authors confirm that there are no conflicts of interest to declare

Figures
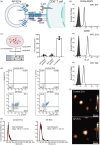
FIGURE 1
FIGURE 1
Establishment of antigen‐presenting EVs (AP‐EVs). (a) Schematic representation of AP‐EVs. The functional pMHCI complex, CD80 and IL‐2 on AP‐EVs interact with TCR, CD28 and IL‐2R, respectively, on antigen‐specific CD8+ T cells. (b) AP‐EV derived from AP‐EV stable cell line were captured with Tim4‐conjugated beads. Surface expression of the OVAp‐MHCI complex, mouse CD80 and mouse IL‐2 on EVs was assessed using flow cytometry. Filled grey shapes represent control EVs, and open black shapes represent AP‐EVs. MFI was presented in top right corner. (c) HEK293T cells were co‐transfected with plasmid expressing CD81‐RFP and CD9‐GFP fusion protein, and EVs were isolated with ultracentrifugation and observed via confocal microscopy. Colocalization of RFP and GFP positive dot was quantified. (d) EVs isolated from the AP‐EV stable cell line or HEK293T cells were stained with fluorescence‐conjugated antibodies. Signal expression on single EVs was analysed by NanoFCM. The upper left dot plot shows control EVs stained for IL‐2 and CD80, lower left dot plot shows AP‐EVs stained for IL‐2 and CD80, the upper right dot plot shows control EVs stained for pMHCI and IL‐2, and the lower right dot plot shows AP‐EVs stained for pMHCI and IL‐2. (e) Size distribution between control EVs and AP‐EVs (red‐shaded region = standard error of the mean). (f) AFM showing AP‐EV and control EV morphology (scale bar = 100 nm). Data (b–f) are representative of two independent experiments. AFM, Atomic force microscopy; AP‐EV, antigen‐presenting EV; EV, extracellular vesicle; GFP, green fluorescent protein; RFP, red fluorescent protein; TCR, T cell receptor.
FIGURE 2
FIGURE 2
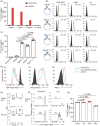
Direct activation of antigen‐specific CD8+ T cells by AP‐EVs. (a) CTV labelled OT‐I T cells were cocultured with AP‐EV or control EV. Bar graph representing the percentage of CTV‐negative OT‐I T cells under different concentrations of control EVs (black) and AP‐EVs (red). (b) Surface expression of the OVAp‐MHCI complex, CD80 and IL‐2 on EVs presented as different signals (alone and in combination). MFI was presented in top right corner. (c) Stimulatory capability of EVs expressing individual signals (1, 2 and 3). CTV‐labelled OT‐I T cells were cultured with each EV type prepared in (b); the percentage of CTV‐negative OT‐I T cells was quantified using flow cytometry. p‐Values were calculated using one‐way ANOVA followed by Dunnett's test. Dots represent technical triplicate. (d) Production of granzyme B and IFN‐γ by CTV‐labelled OT‐I T cells cultured with AP‐EVs, control EVs or anti‐CD/3CD28 beads for 3 days were determined by intracellular staining. (e) Flow cytometric plots of CTV‐labelled OT‐I T (CD45.1) and polyclonal T cells (CD45.2) cultured with either AP‐EVs or control EVs for 3 days. Numbers represent the percentage of OT‐I T cells and polyclonal T cells. (f) Proliferation of OT‐I and polyclonal T cells after culturing with control EVs or AP‐EVs determined by flow cytometry. Numbers represent the percentage of CTV‐negative CD8+ T cells. (g) Percentage of CTV‐negative OT‐I after culturing with AP‐EVs stored at 4°C, −20°C and −80°C for 3 months or freshly prepared AP‐EVs determined by flow cytometry. Dots represent technical triplicate. p‐Values were determined in (c) and (g) using one‐way ANOVA followed by Dunnett's test. Data (a–g) are representative of two independent experiments. ANOVA, analysis of variance; AP‐EV, antigen‐presenting EV; CTV, cell trace violet; EV, extracellular vesicle.
FIGURE 3
FIGURE 3
In vivo activation of antigen‐specific CD8+ T cells by AP‐EVs. (a) CTV‐labelled OT‐I (CD45.1) and polyclonal T cells (CD45.2) were inoculated into CD45.1+CD45.2+ recipient mice. The following day, mice were administered either control EVs, IL‐2/anti‐IL‐2 mAb or AP‐EVs (n = 3 mice per group). Numbers represent the percentage of CTV‐negative OT‐I T cells and polyclonal T cells in spleen 4 days after treatment. (b) Percentage of CTV‐negative donor CD8+ T cells in the spleen (n = 3 mice per group). (c) Proportion of donor CD8+ T cells among total CD8+ T cells in the spleen (n = 3 mice per group). (d) Percentage of CD44highCD62Llow cells among the splenic CD8+ T cells (n = 3 mice per group). (e) Proportion of IFN‐γ+ cells in the spleen (n = 3 mice per group). p‐Values were calculated using two‐way ANOVA (b‐e) followed by Tukey's test. (f) Pharmacokinetic studies of AP‐EVs. Representative MIP positron emission tomography images are shown at 1 min, 30 min, 1 h, and 24 h post‐injection of AP‐EVs. (g) Average radioactivity concentration across tissues presented as the percentage of injected dose per gram tissue (%ID/g) after 24.5 h (n = 4 mice per group). (h,i) Recipient mice were treated with AP‐EVs prior to OT‐I T cell transfer at specific intervals. After 4 days, the proliferation of OT‐I T cells was quantified (n = 3 mice per group). Data (a‐i) are representative of two independent experiments. ANOVA, analysis of variance; AP‐EV, antigen‐presenting EV; EV, extracellular vesicle; MIP, maximum intensity projection.
FIGURE 4
FIGURE 4
Effect of AP‐EV administration on anticancer immunity. (a) Experimental workflow of the in vivo killing assay. CD45.1+CD45.2+ recipient mice were treated with CD45.1+ OT‐I T cells and injected with either control EVs, IL‐2/anti‐IL‐2 mAb or AP‐EVs. The survival of donor CTV‐labelled OVAp‐pulsed CD45.2+ and CFSE‐labelled non‐pulsed CD45.2+ splenocytes was assessed 20 h after infusion. Data are presented as the ratio of OVAp‐pulsed (CTV‐labelled) to non‐pulsed splenocytes (n = 3 mice per group). (b) E.G7 cells were transplanted into recipient mice, followed after 1 day by three treatments with either control EVs, IL‐2/anti‐IL‐2 mAb or AP‐EVs at 3 days intervals. Tumour growth curves represent the untreated (black), control EV (brown), IL‐2/anti‐IL‐2 mAb (blue) and AP‐EV (red) groups (n  =  9 mice per group). (c) Kaplan–Meier survival curve of overall survival. Statistical analysis was performed using a log‐rank (Mantel–Cox) test (n  =  9 mice per group). (d) Mice that previously rejected E.G7 post‐AP‐EV treatment were later subcutaneously challenged with 1 × 10⁵ E.G7 cells. The tumour growth curves compare untreated and AP‐EV‐treated mice. p‐Values were determined using two‐way ANOVA followed by Dunnett's test. (e) Kaplan–Meier survival curve for mice subjected to tumour rechallenge. Statistical analysis was performed using a log‐rank (Mantel–Cox) test (n  =  6 mice per group). Data (a‐c) are representative of two independent experiments. ANOVA, analysis of variance; AP‐EV, antigen‐presenting EV; CTV, cell trace violet; EV, extracellular vesicle.
FIGURE 5
FIGURE 5
Effect of AP‐EVs on the expansion of endogenous antigen‐specific CD8+ T cells and cancer immunity. (a) Mice were treated with either 200 µg control EVs, IL‐2/anti‐IL‐2 mAb or 200 µg AP‐EVs for three times in a 2 days interval. On day 6, PBMCs were collected. Dots showed the percentages of tetramer‐positive cells (n  =  4). Standard deviation was presented in top left corner. (b) Experimental workflow for the in vivo killing assay. Mice were treated with either 200 µg control EVs, IL‐2/anti‐IL‐2 mAb or 200 µg AP‐EVs for three times in a 2 days interval. On day 6, OVAp‐pulsed (CD45.2+) with non‐pulsed (CD45.1+) splenocytes were transferred to recipient mice. The ratios displayed the percentage of OVAp‐pulsed (CD45.2+) with non‐pulsed (CD45.1+) splenocytes in recipient mice's PBMCs. (c) E.G7 cells were inoculated into recipient mice, followed after 1 day by three treatments with either 200 µg of control EVs, IL‐2/anti‐IL‐2 mAb or AP‐EVs for three times at 3 days intervals. The tumour growth curves are shown. (d) Kaplan–Meier survival curve depicting overall survival rates. Statistical analysis was performed using a log‐rank (Mantel–Cox) test (n  =  9 mice per group). (e) Starting from day 5 (tumour size approximately 100 mm3), E.G7 tumour‐bearing mice were treated three times at 3 days intervals with 200 µg of control EVs, AP‐EVs, 200 µg of anti‐PD1 antibody or a combination of AP‐EVs and anti‐PD1 antibody for three times. The tumour growth curves are shown. (f) OVAp‐specific CD8+ T cells in PBMCs were detected on day 14. Percentages of tetramer‐positive cells from tumour‐bearing mice treated with control EVs, AP‐EVs, anti‐PD1 antibody or AP‐EVs with anti‐PD1 antibody are presented (n = 5 mice per group). p‐Values were calculated using one‐way ANOVA followed by Tukey's test. Data (a‐f) are representative of two independent experiments. ANOVA, analysis of variance; AP‐EV, antigen‐presenting EV; EV, extracellular vesicle; PBMC, peripheral blood mononuclear cell.
FIGURE 6
FIGURE 6
AP‐EVs can directly activate TILs. (a) Schematic representation of AP‐EV administration protocol. E.G7 cells were inoculated into recipient mice. The following day, mice received three treatments with either 200 µg control EVs, IL‐2/anti‐IL‐2 mAb or 200 µg AP‐EVs for three times at 3 days intervals. TILs were harvested on day 18 (n = 6 mice per group). (b) Percentage of CD8+OVAp‐tetramer+ cells in TILs. (c) Percentage of IFN‐γ+ CD8+ T cells in TILs. (d) Percentage of OVAp‐tetramer+PD‐1+ exhausted CD8+ T cells. p‐Values were calculated using one‐way ANOVA followed by Dunnett's test. (e) ⁶⁴Cu‐labelled AP‐EVs were administered to untreated and E.G7 tumour‐bearing C57BL/6 mice. AP‐EV accumulation was evaluated 24 h following administration. (f) Time‐activity curve presenting the percentage injected dose per cubic centimetre of tissue (%ID/cc). Data (a‐f) are representative of two independent experiments. ANOVA, analysis of variance; AP‐EV, antigen‐presenting EV; TIL, tumour‐infiltrating lymphocytes.
FIGURE 7
FIGURE 7
Induction of human antigen‐specific T cell expansion, activation and effector function by AP‐EVs in vitro. (a) Schematic illustration of NY‐ESO‐1 single‐chain trimer‐MFG‐E8 fusion protein. (b) Schematic illustration of CD80‐MFG‐E8‐IL2 fusion protein. (c) Human β2m‐deficient 293 cells were transiently transfected with NY‐ESO‐1 single‐chain trimer‐MFG‐E8 fusion protein or co‐transfected with NY‐ESO‐1 single‐chain trimer‐MFG‐E8 fusion protein and CD80‐MFG‐E8‐IL2 fusion protein. EVs were captured with Tim4‐conjugated beads. Histogram figures show the expression of human β2m, CD80 and IL‐2 on EVs. Upper panels show EVs isolated from NY‐ESO‐1 single‐chain trimer‐MFG‐E8 fusion protein transfected β2m‐deficient 293 cells. The bottom panels show EVs isolated from NY‐ESO‐1 single‐chain trimer‐MFG‐E8 fusion protein and CD80‐MFG‐E8‐IL2 fusion protein co‐transfected β2m‐deficient 293 cells. MFI was presented in top left. (d) PBMCs were transduced with NY‐ESO‐1 TCR via lentiviral transfection. Representative dot plots showing NY‐ESO‐1 tetramer staining in NY‐ESO‐1 TCR (Venus)‐positive and Venus‐negative human CD8+ T cells. (e) Nur77 expression in NY‐ESO‐1 TCR‐positive and NY‐ESO‐1 TCR‐negative T cells after 2 h of stimulation with AP‐EVs, signal 1 expressing EVs or control EVs (prepared in c). (f) Percentage of CD69+ NY‐ESO‐1 TCR‐positive and NY‐ESO‐1 TCR‐negative T cells after 1 day of stimulation with 60 µg/mL AP‐EVs, signal 1 expressing EVs or control EVs. (g) IFN‐γ expression in NY‐ESO‐1 TCR‐positive and TCR‐negative CD8+ T cells following 1 day of stimulation with 60 µg/mL AP‐EVs, signal 1 expressing EVs or control EVs. (h) Amount of granzyme B in the supernatant after 4 days of co‐culture determined by ELISA. (i) Numbers of NY‐ESO‐1 TCR‐positive T and NY‐ESO‐1 TCR‐negative T cells following 4 days of stimulation with 60 µg/mL AP‐EVs, signal 1 expressing EVs or control EVs. p‐Values were calculated using two‐way ANOVA (e, f, g, i) and one‐way ANOVA (h) followed by Tukey's test. Data (e–i) are presented as technical triplicates. Data (c–i) are representative of two independent experiments. ANOVA, analysis of variance; AP‐EV, antigen‐presenting EV; EV, extracellular vesicle; PBMC, peripheral blood mononuclear cell; TCR, T cell receptor.

References

    1. Ahmadzadeh, M. , & Rosenberg, S. A. (2006). IL‐2 administration increases CD4+CD25hi Foxp3+ regulatory T cells in cancer patients. Blood, 107, 2409–2414. - PMC - PubMed
    1. Anguille, S. , Van de Velde, A. L. , Smits, E. L. , Van Tendeloo, V. F. , Juliusson, G. , Cools, N. , Nijs, G. , Stein, B. , Lion, E. , Van Driessche, A. , Vandenbosch, I. , Verlinden, A. , Gadisseur, A. P. , Schroyens, W. A. , Muylle, L. , Vermeulen, K. , Maes, M. B. , Deiteren, K. , Malfait, R. , … Berneman, Z. N. (2017). Dendritic cell vaccination as postremission treatment to prevent or delay relapse in acute myeloid leukemia. Blood, 130, 1713–1721. - PMC - PubMed
    1. Ashouri, J. F. , & Weiss, A. (2017). Endogenous Nur77 is a specific indicator of antigen receptor signaling in human T and B Cells. Journal of Immunology, 198, 657–668. - PMC - PubMed
    1. Atkins, M. B. , Lotze, M. T. , Dutcher, J. P. , Fisher, R. I. , Weiss, G. , Margolin, K. , Abrams, J. , Sznol, M. , Parkinson, D. , Hawkins, M. , Paradise, C. , Kunkel, L. , & Rosenberg, S. A. (1999). High‐dose recombinant interleukin 2 therapy for patients with metastatic melanoma: Analysis of 270 patients treated between 1985 and 1993. Journal of Clinical Oncology, 17(7), 2105–2116. - PubMed
    1. Becker, M. W. , Peters, L. D. , Myint, T. , Smurlick, D. , Powell, A. , Brusko, T. M. , & Phelps, E. A. (2023). Immune engineered extracellular vesicles to modulate T cell activation in the context of type 1 diabetes. Science Advances, 9, eadg1082. - PMC - PubMed

MeSH terms

Substances

LinkOut - more resources