. 2025 Mar 28;8(6):e202403102.
doi: 10.26508/lsa.202403102. Print 2025 Jun.

A novel human organoid model system reveals requirement of TCF4 for oligodendroglial differentiation

Affiliations

A novel human organoid model system reveals requirement of TCF4 for oligodendroglial differentiation

Federica Furlanetto et al. Life Sci Alliance. .

Abstract

Heterozygous mutations of TCF4 in humans cause Pitt-Hopkins syndrome, a neurodevelopmental disease associated with intellectual disability and brain malformations. Although most studies focus on the role of TCF4 in neural stem cells and neurons, we here set out to assess the implication of TCF4 for oligodendroglial differentiation. We discovered that both monoallelic and biallelic mutations in TCF4 result in a diminished capacity to differentiate human neural progenitor cells toward myelinating oligodendrocytes through the forced expression of the transcription factors SOX10, OLIG2, and NKX6.2. Using this experimental strategy, we established a novel organoid model, which generates oligodendroglial cells within a human neurogenic tissue-like context. Also, here we found a reduced ability of TCF4 heterozygous cells to differentiate toward oligodendroglial cells. In sum, we establish a role of human TCF4 in oligodendrocyte differentiation and provide a model system, which allows to dissect the disease etiology in a human tissue-like context.


Conflict of interest statement

The authors declare that they have no conflict of interest.

Figures

Figure 1.
Figure 1.. Generation of TCF4-deficient hiPSCs carrying the SON cassette.
(A) Scheme depicting the TCF4 protein including the main functional domains (AD, activation domain; NLS, nuclear localization signal; CE, repressor domain; Rep, repressor domain; bHLH, DNA-binding domain) and the localization of the guide RNA (sgRNA) targeting the bHLH domain of TCF4. (B) Summary of the SON15 clones used in the study and the CRISPR/Cas9-induced deletions (del) present in them. (C) Quantitative RT–PCR of TCF4 transcripts in the TCF4-HET and TCF4-HOM clones relative to the original SON15 cell line (set to 1) and normalized to the housekeeping gene RLP8. Shown are mean values ± SEM (n = 3). **P < 0.005, *P < 0.05, t test. Exact P-values (top to down): 0.018, 0.0098, 0.018. (D) Immunofluorescence stainings of SON15 hiPSCs and genome-edited clones confirming pluripotency of the lines through OCT4 and NANOG expression and simultaneous assessment of TCF4 expression. Note the gradually diminished expression of TCF4 in the HET and the HOM clones. Scale bars = 100 µm. (E) Quantification of TCF4-specific immunocytochemical signal in SON15 hiPSCs and their TCF4 variant clones. Dotted lines represent the median. Exact P-values (top to down): 3.4 × 10−182, 4.6 × 10−193, 1.3 × 10−196; ***P < 0.001. n = 542 cells, WT; n = 1,159 cells, HET; n = 842 cells, HOM; Mann–Whitney U test.
Figure 2.
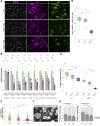
Figure 2.. Characterization of TCF4 variant cells.
(A) Immunocytochemical stainings of NPCs derived from SON15 hiPSCs and genome-edited clones for SOX2 (green), NESTIN (NES; magenta), and PAX6 (gray). Scale bars = 100 μm. (B) Heatmap showing the expression (log2 of counts per million) of selected pluripotency, proliferation, NPC, and neuronal, astroglial, and oligodendroglial markers across samples. There are four replicates per condition. (C) Heatmap showing the Z-score of TCF4 regulon activity (upper row) and TCF4 mRNA expression (lower row) across samples. Note the gradual decrease of the TCF4 regulon activity and TCF4 mRNA expression from TCF4-WT to TCF4-HET to TCF4-HOM samples. (D) Quantification of TCF4 regulon activity across samples as shown by box plot and jitters. n = 4 for all conditions; exact P-values (top to bottom): 0.0000121, 0.0000004, 0.001958. Boxplots show median, quartiles (box), and range (whiskers). (E) Dot plot indicating the correlation between TCF4 mRNA expression and TCF4 regulon activity. n = 4 for all conditions; Pearson’s correlation coefficient and P-value are indicated inside the plot. (F) Timeline showing the different steps of the oligodendroglial differentiation protocol from the NPC stage (N-SAG, neural progenitor medium containing SAG [smoothened agonist]; GIM, glial induction medium; GDM, glial differentiation medium). (G) Quantification of the fraction of SOX10- and OLIG2-expressing NPCs upon Dox induction across experimental lines shows no difference. n = 3. (H) Images showing NPCs 4 d after glial induction and stained for the proliferation marker Ki-67 (green), SOX10 (magenta), and O4 (blue). Scale bars = 100 μm. (I) Quantification of the fraction of double (left panel, SOX10+ Ki-67+)- and triple-positive (right panel, SOX10+ O4+ Ki-67+) cells over SOX10-positive cells as indicated in the graphs. Left and right plot: WT: n = 6; HET: n = 6; HOM: n = 6. Boxplots show median, quartiles (box), and range (whiskers). For (D, E, G, I), one-way ANOVA with Tukey’s post hoc test. **<0.01, ***P < 0.001, ns = nonsignificant.
Figure 3.
Figure 3.. Oligodendroglial differentiation deficit in TCF4 variant cells.
(A) Representative images showing stainings using antibodies against SOX10 (gray), O4 (magenta), and MBP (green) to visualize the efficiencies of oligodendroglial differentiation in SON15 hiPSC-derived cells with and without TCF4 mutations at day 18 after onset of differentiation. Scale bars = 100 μm. (B) Quantitative RT–PCR of transcripts for the pre-myelinating marker NKX2.2, myelin proteins (MBP, PLP1, MOG, CNP, GALC), and lipid metabolic enzymes (FASN, HMGCR) in the TCF4-HET and TCF4-HOM cells relative to the original SON15 cells (set to 1; dotted line) after 18 d of differentiation. Shown are mean values ± SEM (n = 3). Exact P-values (left to right, top to bottom): 0.0007, 0.01493, 0.0001, 0.0062, 0.0028, 0.0421, 0.0013, 0.0015, 0.0171, 0.0078, 0.0093, <0.0001, 0.044. *P < 0.05, **P < 0.01, ***P < 0.001, ns = nonsignificant. Two-way ANOVA with Tukey´s post hoc test. (C) Quantification of O4- and MBP-positive myelinating oligodendrocytes after 18 d of differentiation normalized to all SOX10-positive cells. Exact P-values (top to bottom): O4: 0.0027, 0.1580, 0.1713; WT: n = 7, TCF4-HET: n = 5, TCF4-HOM: n = 5; MBP: 3.8 × 10⁻⁸, 1.6 × 10⁻⁵, 0.0142; ***P < 0.001, **P < 0.01, *P < 0.05. WT: n = 7, TCF4-HET: n = 5, TCF4-HOM: n = 5. Boxplots show median, quartiles (box), and range (whiskers). (D) Box-and-jitter plot showing the fraction of MBP-positive cells over O4 cells. Exact P-values (top to down): 0.0000010, 0.0000206, 0.4403782; WT: n = 8, TCF4-HET: n = 6, TCF4-HOM: n = 6; boxplots show median, quartiles (box), and range (whiskers). (E) Quantification of normalized MBP intensity across conditions as shown by box, violin, and jitter plot. Exact P-values for all comparisons: <2.2 × 10−308; WT: n = 3,158, TCF4-HET: n = 2,135, TCF4-HOM: n = 1,404. Boxplots show median, quartiles (box), and range (whiskers). (F) Example of O4-positive cells with complex (circle) and compact (star) morphology. (G) Quantification of the fraction of compact and complex cells across conditions at d14 (left panel) and d18 (right panel) upon induction of oligodendroglial differentiation. Exact P-values (top to bottom): d14: 0.0039, 0.0068, 0.8347; d18: 0.0051, 0.0582, 0.2960; n = 4 for all conditions. For (C, D, E, G), *P < 0.05, **P < 0.01, ***P < 0.001, ns = nonsignificant. One-way ANOVA with Tukey´s post hoc test.
Figure 4.
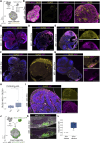
Figure 4.. Mixed organoids contain oligodendroglial cells.
(A) Experimental scheme for generating mixed organoids using control (ctrl) hiPSC and SON cassette containing hiPSCs. Dox induction starting on d30 after aggregation of hiPSCs induces SOX10, OLIG2, and NKX6.2 expression in organoid-resident SON cells. (B) Immunofluorescence stainings against MAP2 (magenta) and OLIG2 (yellow) to visualize cellular organization and cell types in organoid slices on d40 post-initial cell aggregation, that is, 10 d of Dox treatment. The right panel shows zoom-in as delineated in the overview picture on the left. DAPI (gray) was used to counterstain nuclei. Scale bars = 500 μm; 200 μm for zoom-in. (C) Organoid slice of a mixed organoid without Dox treatment stained for MAP2 (magenta) and OLIG2 (yellow) confirms the absence of OLIG2-expressing cells in these organoids. Scale bar = 500 μm. (D) Immunofluorescence staining of mixed organoid containing OLIG2 (yellow)- and CNP (magenta)-positive SON15 cells on d40 after aggregation of hiPSCs, that is, 20 d of Dox treatment. DAPI (blue) was used to counterstain nuclei. Scale bar = 200 μm. (E) Representative image showing the existence of OLIG2 (yellow)- and CNP (magenta)-positive SON15 cells on d50 after aggregation of hiPSCs, that is, 20 d of Dox treatment. DAPI (blue) was used to counterstain nuclei. Scale bar = 500 μm; 200 μm for zoom-ins. (F) Image showing mixed organoid slice (d40) containing OLIG2-expressing cells (yellow). Note that at this timepoint (10 d Dox treatment), no MBP expression can be detected. Zoom-in taken from overview in small inset (within a dashed line). Scale bar = 500 μm; 200 μm for zoom-in. (G) Image of an organoid slice confirms the appearance of OLIG2 (yellow)-expressing cells exhibiting oligodendroglial morphology as shown by MBP (magenta) expression on d50. Zoom-in taken from overview in small inset (within a dashed line). DAPI (blue) was used to counterstain nuclei. Scale bar = 500 μm; 200 μm for zoom-ins. (H) Quantification of the fraction of proliferating cells as determined by Ki-67 and OLIG2 staining. ns = nonsignificant. d40: n = 6; d50: n = 7; n represents individual ventricles of three different organoids. Boxplots show median, quartiles (box), and range (whiskers). (I) Image showing examples of Ki-67- and OLIG2-positive cells in d40 organoid slices 10 d post-Dox treatment. DAPI (blue) was used to counterstain nuclei. Scale bar = 200 μm. (J) Graphical scheme describing the experimental setup to constitutively label SON cells. (K, L) Immunofluorescence stainings of mixed organoids containing GFP-expressing SON cells. Note the co-expression of OLIG2 (white) and GFP allowing quantification of the induction rate as shown in (L). Scale bar = 200 μm. (L) Induction rate of the SON cassette upon Dox treatment of mixed organoids as quantified by OLIG2-positive cells over GFP-positive SON15 hiPSCs. n = 3 for -Dox, n = 9 for +Dox; n represents individual organoids. Boxplots show median, quartiles (box), and range (whiskers).
Figure 5.
Figure 5.. Assessment of TCF4 deficiency in oligodendroglial cells reveals impaired differentiation within a human tissue–like context.
(A) Experimental scheme for generating mixed organoids using control (ctrl) hiPSC and SON15 hiPSCs either expressing WT or being heterozygously mutant for TCF4. Dox induction follows the same timeline as described in Fig 4A. (B) Images showing OLIG2 (green) and Ki-67 (magenta) immunoreactivity in mixed organoids (d40). Scale bars = 500 μm. (C) Box, violin, and jitter plot showing the quantification of Ki-67 and OLIG2 double-positive cells over all OLIG2-positive cells. Exact P-value: 0.4432. WT: n = 6 organoids; HET: n = 6 organoids. (D) Pictures showing CNP-expressing cells exhibiting oligodendroglial morphology within brain organoids generated with TCF4-WT SON15 cells (upper panel) or TCF4-HET SON15 cells (lower panel). DAPI (gray) was used to counterstain nuclei. Scale bars = 500 μm; 200 μm for zoom-ins. (E) Quantification of the fraction of OLIG2 and CNP double-positive cells over total OLIG2-positive cells at d40 and d50. Exact P-values: d50: 1.6 × 10⁻⁶, d40: 0.1645. WT: n = 11 organoid slices from 1 batch for d40, 9 organoid slices from 1 batch for d50; HET: n = 5 organoid slices from 1 batch for d40, 8 organoid slices from 1 batch for d50. (F) Quantification of the fraction of OLIG2 and MBP double-positive cells over total OLIG2-positive cells at d40 and d50. Exact P-values (top to bottom): 0.01485, 0.9996. WT: d40: n = 4 organoids, d50: n = 6 organoids; HET: d40: n = 7 organoids, d50: n = 5 organoids. (G) Pictures showing immunohistochemical stainings of OLIG2 (green) and the apoptosis marker PARP1 (magenta). Scale bars = 500 µm. (H) Quantification of PARP1 and OLIG2 double-positive cells over OLIG2-positive cells in mixed organoids (d40, d50) as shown by box, violin, and jitter plots. Exact P-value: 0.9245. WT: n = 6 organoids, HET: d40: n = 6 organoids. For (C, E, F, H), *<0.05, ***<0.001, ns = nonsignificant. One-way ANOVA with Tukey´s post hoc test. Boxplots show median, quartiles (box), and range (whiskers).

References

    1. Avery S, Hirst AJ, Baker D, Lim CY, Alagaratnam S, Skotheim RI, Lothe RA, Pera MF, Colman A, Robson P, et al. (2013) BCL-XL mediates the strong selective advantage of a 20q11.21 amplification commonly found in human embryonic stem cell cultures. Stem Cell Rep 1: 379–386. 10.1016/j.stemcr.2013.10.005 - DOI - PMC - PubMed
    1. Betancur C (2011) Etiological heterogeneity in autism spectrum disorders: More than 100 genetic and genomic disorders and still counting. Brain Res 1380: 42–77. 10.1016/j.brainres.2010.11.078 - DOI - PubMed
    1. Bohlen JF, Cleary CM, Das D, Sripathy SR, Sadowski N, Shim G, Kenney RF, Buchler IP, Banerji T, Scanlan TS, et al. (2023) Promyelinating drugs promote functional recovery in an autism spectrum disorder mouse model of Pitt-Hopkins syndrome. Brain 146: 3331–3346. 10.1093/brain/awad057 - DOI - PMC - PubMed
    1. Chen F, LoTurco J (2012) A method for stable transgenesis of radial glia lineage in rat neocortex by piggyBac mediated transposition. J Neurosci Methods 207: 172–180. 10.1016/j.jneumeth.2012.03.016 - DOI - PMC - PubMed
    1. Chen S, Zhou Y, Chen Y, Gu J (2018) fastp: an ultra-fast all-in-one FASTQ preprocessor. Bioinformatics 34: i884–i890. 10.1093/bioinformatics/bty560 - DOI - PMC - PubMed

MeSH terms

Supplementary concepts

LinkOut - more resources