. 2025 Mar 28;16(1):3038.
doi: 10.1038/s41467-025-57616-w.

Targeting senescent hepatocytes for treatment of metabolic dysfunction-associated steatotic liver disease and multi-organ dysfunction

Affiliations

Targeting senescent hepatocytes for treatment of metabolic dysfunction-associated steatotic liver disease and multi-organ dysfunction

Kuo Du et al. Nat Commun. .

Erratum in

Abstract

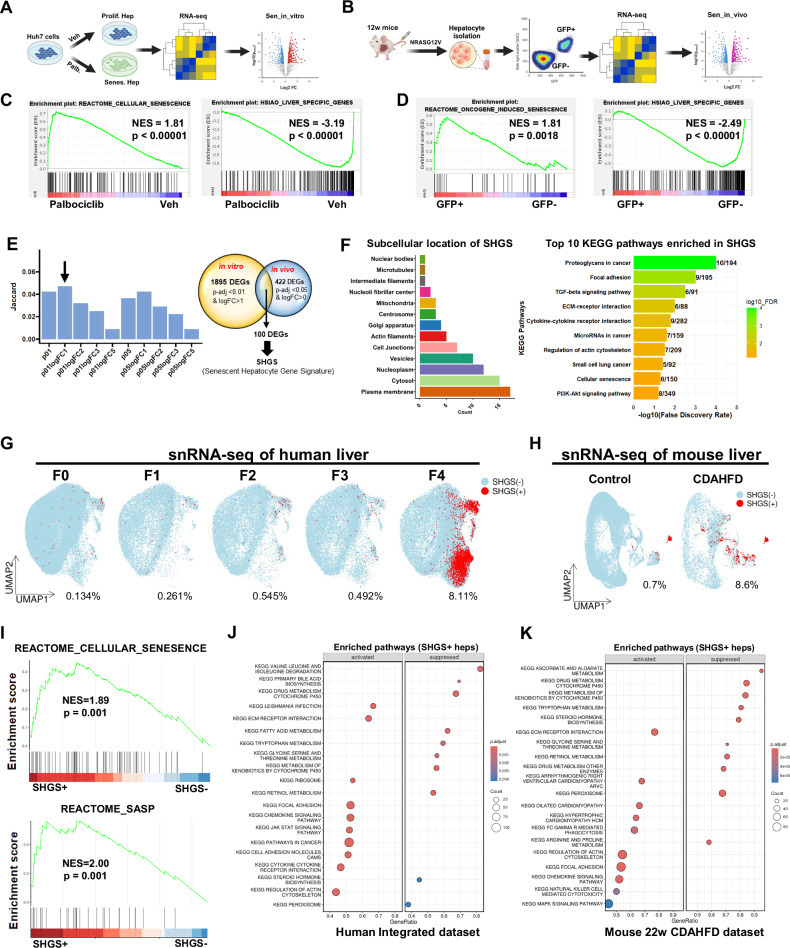
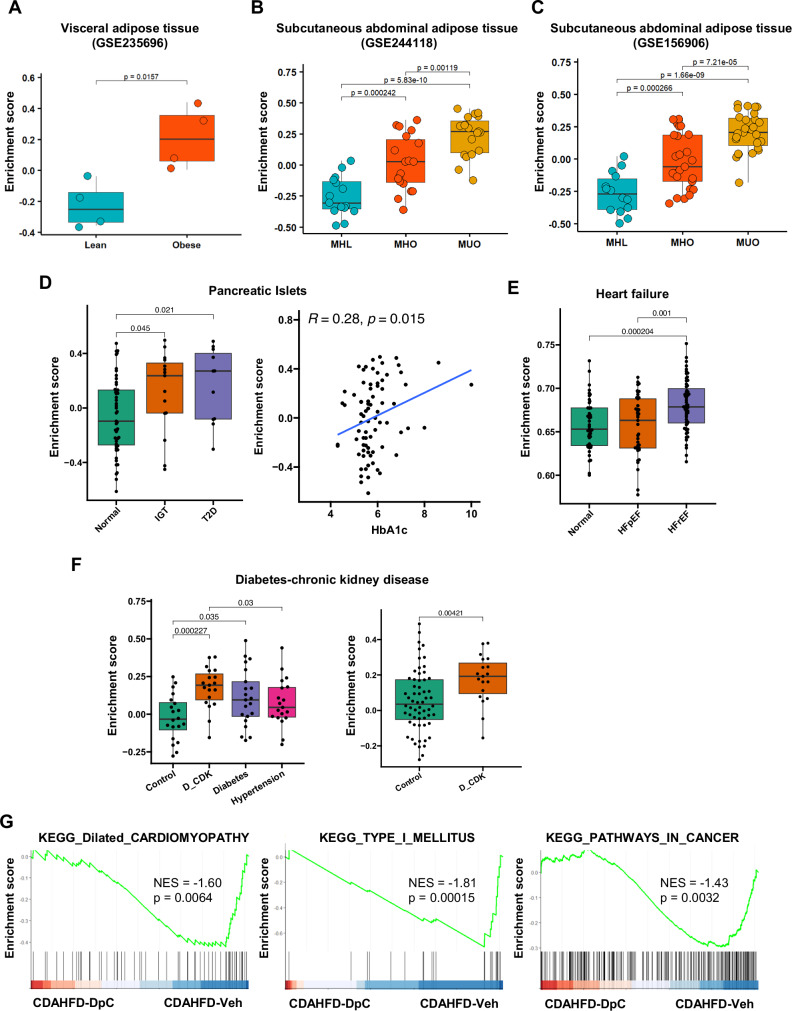
Senescent hepatocytes accumulate in metabolic dysfunction-associated steatotic liver disease (MASLD) and are linked to worse clinical outcomes. However, their heterogeneity and lack of specific markers have made them difficult to target therapeutically. Here, we define a senescent hepatocyte gene signature (SHGS) using in vitro and in vivo models and show that it tracks with MASLD progression/regression across mouse models and large human cohorts. Single-nucleus RNA-sequencing and functional studies reveal that SHGS+ hepatocytes originate from p21+ cells, lose key liver functions and release factors that drive disease progression. One such factor, GDF15, increases in circulation alongside SHGS+ burden and disease progression. Through chemical screening, we identify senolytics that selectively eliminate SHGS+ hepatocytes and improve MASLD in male mice. Notably, SHGS enrichment also correlates with dysfunction in other organs. These findings establish SHGS+ hepatocytes as key drivers of MASLD and highlight a potential therapeutic strategy for targeting senescent cells in liver disease and beyond.


Conflict of interest statement

Competing interests: A.M.D., S.G., and M.F.A. received grant funding from Boehringer Ingelheim paid to Duke University to support human transcriptomics analysis. The remaining authors declare no competing interests.

Figures

Fig. 1
Fig. 1. Development of Senescent Hepatocyte Gene Signature (SHGS) to identify and characterize senescent hepatocytes during MASLD pathogenesis.
A Schematic representation of the experimental design (created in BioRender. Du, K. (2025) https://BioRender.com/d27y359) of in-vitro hepatocyte senescence model: Huh7 cells were treated with vehicle (0.1% DMSO) or palbociclib for 8 days. RNA was isolated and subjected to RNA-seq analysis. B Schematic representation of the experimental design of in-vivo hepatocyte senescence model: Twelve-week-old mice were injected with NRASG12V-IRES-GFP plasmid and CMV-SB13 through hydrodynamic tail vein injection. Six days later, GFP-positive (NRASG12V overexpressing hepatocytes) and GFP-negative (untransduced hepatocytes) were isolated via low-pressure fluorescence-activated cell sorting following liver perfusion and then subjected to RNA-seq analysis (GSE145642). GSEA revealed that the transcriptomes of (C) palbociclib-treated Huh7 cells and (D) GFP+ primary hepatocytes are enriched with genes involved in cellular senescence but depleted with genes involved in liver-specific functions. E Jaccard index was used to examine the similarity of overlapping DEGs of hepatocytes from above in-vitro and in-vivo models. Venn diagram identified 100 overlapping DEGs that are upregulated in both the in vitro and in vivo senescent models. These 100 DEGs were defined as SHGS (senescent hepatocyte gene signature). F Subcellular location of SHGS genes and the top 10 KEGG pathways enriched in SHGS. G An integrated human single-nucleus (sn) RNA sequencing dataset was created by merging snRNA-seq data from GSE202379 (n = 47 samples) with our Duke snRNA-seq data (n = 10 samples). Deconvolution analysis using SHGS in this integrated hepatocyte dataset revealed that SHGS-positive hepatocytes increase in human livers as MASLD progresses (F0, n = 12; F1, n = 9; F2, n = 12; F3, n = 12; F4, n = 12). H sn-RNA sequencing data revealed that SHGS-positive hepatocytes also accumulate in livers of mice fed with CDA-HFD for 22 weeks (n = 3 mice/group). I GSEA confirmed that the transcriptomes of SHGS+ human hepatocytes are enriched with genes involved in cellular senescence and SASP. GSEA also identified the top 20 KEGG pathways in the transcriptomes of SHGS+ hepatocytes from MASLD patients (J) and CDA-HFD-fed mice (K). The P values were calculated using permutation test (two sided), then adjusted for multiple-comparison testing using the Benjamini–Hochberg method in (C, D, E, F, I, J, K). NES normalized enrichment score.
Fig. 2
Fig. 2. SHGS tracks with MASLD progression, regression, and clinical outcomes.
A Deconvolution analysis in bulk liver RNA-seq data of the Duke MASLD human cohort (GSE213623, n = 368) demonstrated that SHGS is enriched in MASLD patients versus healthy controls. B SHGS enrichment scores correlate negatively with albumin levels, but positively with serum AST and Fib4 score in MASLD patients. C SHGS enrichment scores progressively increase with steatosis, hepatocyte ballooning, portal inflammation, and fibrosis severity during MASLD progression (GSE213623, n = 368). D SHGS was also applied to deconvolute liver transcriptomic data sets of MASLD patient cohorts from Germany (GSE33814, n = 44), Japan (GSE167523, n = 98) (H), USA (GSE49541, n = 72), and Europe (GSE135251, n = 216). In all cohorts, SHGS is more enriched in patients with MASH, and in patients with advanced liver fibrosis (F3F4) versus mild fibrosis (F0F1). E SHGS enrichment scores correlate with a high risk for primary MASLD-HCC (GSE193066, n = 106) and recurrent MASLD-HCC (GSE193080, n = 59). HCC risk was pre-determined using an etiology-agnostic prognostic liver signature (PLS) developed by Dr. Yujin Hoshida’s group. SHGS enrichment scores were reduced in (F) subsequent follow-ups after bariatric surgery (GSE83452, n = 25) and (G) statin treatment (GSE130991, n = 157) interventions that improve MASLD. Boxplots show the upper quantile (75%), median (50%), and lower quantile (25%) of overall data distribution (A, C, D, E, G). p-values were calculated using two-sided Wilcoxon’s rank-sum test in (A, C, D, E, G), Pearson’s correlation test in (B), and paired t-test in (F).
Fig. 3
Fig. 3. Comparative evaluation of SHGS against 13 senescence and aging-related gene signatures across MASLD cohorts.
A Gene set size comparison showing SHGS as a relatively small gene set compared to 13 other senescence- and aging-related signatures. B Jaccard similarity matrix illustrating pairwise overlap among 14 gene signatures, with SHGS showing minimal overlap with others, emphasizing its unique composition. CJ Heatmaps of AUC values for SHGS and other gene signatures across MASLD datasets: C from GSE49541 (F3/F4 vs F0/F1), DF from GSE213621 (MASLD vs Control, F3/F4 vs Control, and F3/F4 vs F0/F1), GI from the Germany cohort GSE33814 (MASLD vs Control, MASH vs Control, and MASH vs MAFL), and (J) from the Japan cohort GSE167523 (MASH vs MASLD). These comparisons demonstrate SHGS’s predictive performance across diverse datasets. K Boxplot summarizing AUC rankings for SHGS and other gene signatures across eight comparisons. Each point represents the rank of a specific signature within a dataset, with boxplots display the upper quantile (75%), median (50%), and lower quantile (25%) of overall data distribution. SHGS ranks highest in four comparisons, second in two, and fourth or fifth in the remaining two, highlighting its superior and consistent performance.
Fig. 4
Fig. 4. Senescent hepatocytes induce pathogenic reprogramming of neighboring hepatic cells through paracrine mechanisms.
A Huh7 cells were treated with 1 μM palbociclib or its vehicle for 8 days. The cells were then thoroughly washed with PBS and incubated with fresh medium (without palbociclib) for 24 h. Conditioned medium (CM) was harvested for recipient cell culture for 72 h (created in BioRender. Du, K. (2025) https://BioRender.com/n01t730). B CM from vehicle or palbociclib-treated Huh7 cells was placed onto originally proliferating Huh7 cells. Secondary senescence in these Huh7 cells was assessed by western blot analysis of cell cycle/senescence markers, SA-β-Gal staining, and mRNA expression of SASP factors in CM-treated Huh7 cells (n = 5 replicates/group). CM from senescent Huh7 cells also induces (C, D) HSC fibrogenesis, as indicated by the mRNA and protein expression of proliferative and profibrogenic markers (n = 4 replicates/group); EF macrophage activation, as indicated by the mRNA and protein expression of proliferative and proinflammatory markers (n = 6 replicates/group); GH LSEC capillarization, as indicated by the altered expression of LSEC functional markers and impaired tube formation in the tube assay (n = 3 replicates/group). Scale bars, 100 μm. Data are graphed as mean ± sem. The P values were calculated using unpaired, two-tailed Student’s t-test in (B, C, E, G). Source data are provided as a Source Data file.
Fig. 5
Fig. 5. Deficiency of cellular senescent program protects against MASLD.
snRNA-seq analyses revealed increased expression of CDKN1A in hepatocytes in (A) human livers during MASLD progression (F0, n = 12; F1, n = 9; F2, n = 12; F3, n = 12; F4, n = 12), and in (B) mice fed with CDA-HFD diet or chow diet for 22 weeks (n = 3 mice/group). Violin plot showed the maxima, upper quantile (75%), median (50%), lower quantile (25%), and minima of overall data distribution across fibrosis stages. C GSEA revealed that the transcriptomes of CDKN1A+ hepatocytes are enriched with genes involved in aging but depleted of genes involved in liver-specific functions. D Schematic representation of the experimental design (created in BioRender. Du, K. (2025) https://BioRender.com/n01t730). E Western blot analysis of p21 expression. F Representative images of liver sections stained with H&E, αSMA, F4/80, and Sirius Red in WT and p21 KO mice on either chow diet or CDA-HFD (scale bars, 100 μm), and (G) corresponding quantification of positively stained areas in liver sections (Chow-WT: n = 3; Chow-p21KO: n = 3; CDAHFD-WT: n = 11; CDAHFD-p21KO: n = 8). H Western blot analysis of senescence and fibrosis markers in WT and p21 KO mice. Data are graphed as mean ± sem. p values were calculated using two-sided permutation test, then adjusted for multiple comparison testing using the Benjamini–Hochberg method in (C), and two-tailed Student’s t-test in (A, B, G, H). Source data are provided as a Source Data file.
Fig. 6
Fig. 6. Chemical library screening identified novel senolytics for senescent hepatocytes.
A Schematic of the screening workflow (created in BioRender. Du, K. (2025) https://BioRender.com/n01t730). A library of 2100 bioactive compounds was tested on proliferating and senescent hepatocytes (Huh7) to identify senolytic compounds. Cell viability was measured using the CellTiter-Glo assay. B Pie chart showing the target categories of the top 50 compounds effective against senescent cells. Compounds targeting proteasomes, microtubules, sodium channels, and HDACs were among the top hits. C Scatter plot of the compounds screened, highlighting Dp44mT as a lead senolytic. The y-axis P/S shows relative cell selectivity, and the x-axis △P-S shows relative cytotoxicity comparing senescent vs proliferating Huh7 cells. D Time course of cell viability for proliferating and senescent Huh7 cells treated with Dp44mT (left) or DpC (right) (n = 3 per group). Senescent cells show significantly reduced viability over time in response to both compounds. E Flow cytometry analysis of cell death using FITC Annexin V Apoptosis Detection Kit. F Representative images of copper staining in senescent Huh7 cells compared to proliferating Huh7. Scale bars, 100 μm. G Bar plot quantifying copper concentrations by ELISA in senescent versus proliferating Huh7 cells (n = 3 per group). H Cell viability assays showing the effects of the iron chelator DFO, copper chelator TM, and the supplementation of exogenous FeSO4 or CuSO4 on Dp44mT/DpC-induced cytotoxicity in senescent and proliferating Huh7 cells (n = 4 per group). I GSEA of senescent Huh7 cells treated with Dp44mT showed Dp44mT increased expression of genes associated with cellular response to copper ions and and apoptosis. Data are graphed as mean ± SEM. The P values were calculated using unpaired, two-tailed Student’s t-test in (D, G, H); two-sided permutation test, then adjusted for multiple-comparison testing using the Benjamini–Hochberg method in (I). Source data are provided as a Source Data file.
Fig. 7
Fig. 7. Novel senolytic DpC improves MASLD.
A Schematic representation of the experimental design (created in BioRender. Du, K. (2025) https://BioRender.com/n01t730): mice were fed a CDA-HFD for 10 weeks to induce MASH, and DpC or vehicle was given by gavage two times per week for the last 4 weeks (CDAHFD-Veh: n = 7; CDAHFD-DpC: n = 6). B Representative images of liver sections stained with β-Gal, p21, H&E, Oil Red O, Sirius Red, and F4/80. Scale bars, 100 μm. C Quantification of positively stained β-Gal or p21 areas. D Liver/body weight ratio, serum ALT and AST levels. E Quantification of positively stained Oil Red O, Sirius Red, or F4/80 areas. F Western blot analysis of fibrosis and senescence markers in liver tissues from CDAHFD-fed mice treated with vehicle or DpC. The integrated density of each band was normalized to the β-tubulin band intensity from the same sample to account for loading variability. The relative expression levels were then calculated by comparing the normalized values to those of the control group (chow-fed mice) set as 1.0. The mean ± SEM of these relative expression levels was reported. G Gene Set Enrichment Analysis (GSEA) plots showing suppression of ECM receptor interaction, inflammatory response, and SASP-related pathways in DpC-treated mice compared to vehicle-treated mice. H Deconvolution analysis reveals that DpC decreased liver enrichment with SHGS+ hepatocytes. Boxplots display the upper quantile (75%), median (50%), and lower quantile (25%) of overall data distribution. Data are graphed as mean ± sem. The P values were calculated using unpaired, two-tailed Student’s t-test in (C, D, E, F); and using two-sided permutation test, then adjusted for multiple-comparison testing using the Benjamini–Hochberg method in (G, H). Source data are provided as a Source Data file.
Fig. 8
Fig. 8. Hepatocyte senescence correlate with multi-organ dysfunction.
A Box plot showing the enrichment of SHGS+ hepatocytes in visceral adipose tissue (VAT) from lean individuals and individuals with obesity (GSE235696). SHGS enrichment is significantly higher in individuals with obesity (Lean: n = 4, obesity: n = 4). B Box plot showing SHGS enrichment in subcutaneous abdominal adipose tissue from metabolically healthy lean individuals (MHL), metabolically healthy individuals with obesity (MHO), and metabolically unhealthy individuals with obesity (MUO) (GSE244118). SHGS enrichment is highest in MUO individuals (MHO: n = 15, MHO: n = 19, MUO: n = 19). C SHGS enrichment in subcutaneous abdominal adipose tissue from MHL, MHO, and MUO individuals in a second dataset (GSE156906). The trend of higher SHGS enrichment in MUO individuals is replicated (MHO: n = 14, MHO: n = 25, MUO: n = 17). D Box plot showing SHGS enrichment in pancreatic islets from individuals with varying levels of insulin sensitivity and hyperglycemia. SHGS enrichment positively correlates with HbA1c levels (Normal: n = 51, IGT: n = 15, T2D: n = 11). E Box plot showing SHGS enrichment in failing hearts with preserved ejection fraction (HFpEF; n = 41) and failing hearts with reduced ejection fraction (HFrEF, n = 59), compared to Normal (n = 45). F Box plot showing SHGS enrichment in patients with diabetes-chronic kidney disease (D-CKD; n = 19), diabetes (n = 21), and hypertension (n = 19) (left panel). By merging Normal, diabetes, and hypertension into Control, significant SHGS enrichment in the D-CKD group persisted relative to this combined control group. G Gene Set Enrichment Analysis (GSEA) plots showing the suppression of pathways related to dilated cardiomyopathy, type 1 diabetes mellitus, and cancer in DpC-treated mice with CDAHFD-induced MASH. Boxplot shows the upper quantile (75%), median (50%), and lower quantile (25%) of overall data distribution. p-values were calculated using two-sided Wilcoxon Rank Sum test for box plots in (A, B, C, D) (left), (E, F), and Pearson’s correlation test for in (D) (right), and permutation test, then adjusted for multiple-comparison testing using the Benjamini–Hochberg method in (G).

References

    1. Sanyal, A. J. et al. Prospective study of outcomes in adults with nonalcoholic fatty liver disease. N. Engl. J. Med.385, 1559–1569 (2021). - PMC - PubMed
    1. Paik, J. M. et al. Global burden of NAFLD and chronic liver disease among adolescents and young adults. Hepatology75, 1204–1217 (2022). - PubMed
    1. Estes, C. et al. Modeling NAFLD disease burden in China, France, Germany, Italy, Japan, Spain, United Kingdom, and United States for the period 2016-2030. J. Hepatol.69, 896–904 (2018). - PubMed
    1. Golabi, P. et al. Prevalence and long-term outcomes of non-alcoholic fatty liver disease among elderly individuals from the United States. BMC Gastroenterol.19, 56 (2019). - PMC - PubMed
    1. Lopez-Otin, C., Blasco, M. A., Partridge, L., Serrano, M. & Kroemer, G. Hallmarks of aging: an expanding universe. Cell186, 243–278 (2023). - PubMed

MeSH terms

Substances

LinkOut - more resources