. 2025 May;22(5):527-540.
doi: 10.1038/s41423-025-01283-w. Epub 2025 Mar 28.

Tumor cells that resist neutrophil anticancer cytotoxicity acquire a prometastatic and innate immune escape phenotype

Affiliations

Tumor cells that resist neutrophil anticancer cytotoxicity acquire a prometastatic and innate immune escape phenotype

Jagoda Agnieszka Szlachetko et al. Cell Mol Immunol. 2025 May.

Abstract

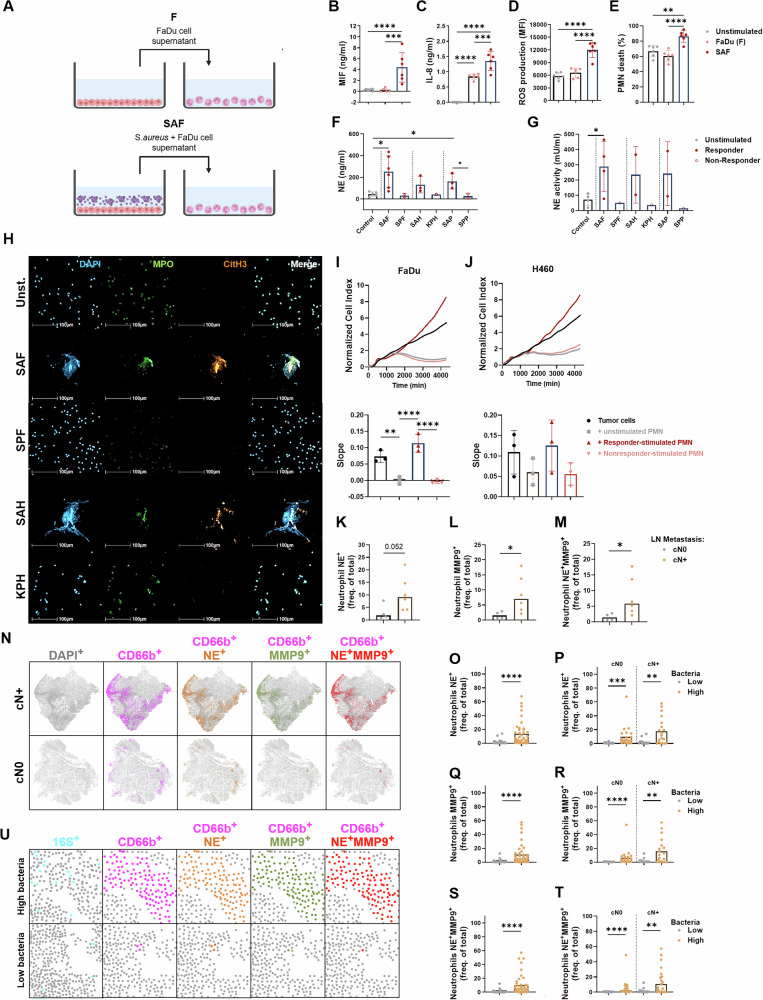
In the tumor host, neutrophils may exhibit protumor or antitumor activity. It is hypothesized that in response to host-derived or therapy-induced factors, neutrophils adopt diverse functional states to ultimately execute these differential functions. Here, we provide an alternative scenario in which the response of an individual tumor cell population determines the overall protumor versus antitumor outcome of neutrophil‒tumor interactions. Experimentally, we show that human neutrophils, which are sequentially stimulated with bacteria and secreted factors from tumor cells, kill a certain proportion of tumor target cells. However, the majority of the tumor cells remained resistant to this neutrophil-mediated killing and underwent a functional, phenotypic and transcriptomic switch that was reminiscent of partial epithelial‒to-mesenchymal transition. This cell biological switch was associated with physical escape from NK-mediated killing and resulted in enhanced metastasis to the lymph nodes in a preclinical orthotopic mouse model. Mechanistically, we identified the antimicrobial neutrophil granule proteins neutrophil elastase (NE) and matrix metalloprotease-9 (MMP-9) as the molecular mediators of this functional switch. We validated these data in patients with head and neck cancer and identified bacterially colonized intratumoral niches that were enriched for mesenchymal tumor cells and neutrophils expressing NE and MMP-9. Our data reveal the parallel execution of tumor cytotoxic and prometastatic activity by activated neutrophils and identify NE and MMP-9 as mediators of lymph node metastasis. The identified mechanism explains the functional dichotomy of tumor-associated neutrophils at the level of the tumor target cell response and has implications for superinfected cancers and the dysbiotic tumor microenvironment.

Keywords: Staphylococcus aureus; Dysbiosis and oral microbiome; Epithelial‒mesenchymal transition; Lymphatic metastasis; Neutrophil extracellular traps; Tumor-associated neutrophils; neutrophil elastase.


Conflict of interest statement

Competing interests: SB declares research funds received by Roche/Genentech. These funds did not affect the work presented here. The other authors declare that they have no potential conflicts of interest.

Figures

Fig. 1
Fig. 1
Bacterial stimulation triggers antitumorigenic tumor cell–neutrophil cross-talk. The description and nomenclature of the supernatants can be found in Table S3. A Upper part: For F production, FaDu cells were cultured for 24 h. For FP production, PMNs were stimulated with FaDu supernatant (F) for 20 h. Lower part: For SAF production, FaDu tumor cells were first ‘primed/stimulated’ with Staphylococcus aureus for 12 h; the supernatant was harvested, centrifuged and filtrated to remove bacteria. For SAFP production, PMNs were stimulated with SAF for 20 h. Scheme was prepared using a BioRender. B Hematoxylin staining was performed on FaDu cells that were stimulated with the indicated supernatants for 72 h. CG Supernatants as indicated in A were used to stimulate tumor cells. An MTT assay C, a Casy hemocytometer total cell count D, LDH release E, and an AnnexinV/7AAD  flow cytometry assay F, G were used to determine cell counts and cell death. H Tumor responder cells were exposed to the indicated supernatants, and proliferation was measured via BrdU. For all the experiments, the data were normalized to unstimulated cells as a baseline. Statistical analysis was performed via the nonparametric Friedman test, followed by Dunn’s multiple comparisons test, and parametric one-way or two-way ANOVA, both followed by Tukey’s multiple comparisons test: *p < 0.05, **p < 0.01, ****p ≤ 0.0001. In C, the data are displayed as the means ± SDs of 4 independent experiments (n = 4). In DH, the data are displayed as individual values of 3-9 independent experiments plus the mean ± SD (n = 3–9)
Fig. 2
Fig. 2
Neutrophil cytotoxicity-resistant mesenchymal tumor cells display a prometastatic and EMT-like transcriptional program. A description of the supernatants can be found in Table S3. A qPCR was performed on FaDu cells after 6 h of stimulation with the supernatants. The results are normalized to β-actin and untreated cells as a reference sample (RQ = 1); n = 7, n indicates the number of independent experiments. Supernatants are designated as follows: Control = untreated FaDu/H460 tumor cells, responder = cells treated with SAFP/SAHP supernatant. B Heatmap depicting DEGs between the control and responder samples. The genes shown correspond to all genes with a p-adjusted value < 0.05 from the list of selected genes shown in Table S4. The labeled genes correspond to those whose p-adjusted values are < 0.001. The complete set of genes is shown in Fig. S3A. C Gene set enrichment analysis (GSEA) was performed on the differentially expressed genes between the control and responder samples from FaDu. Gene sets containing the word ‘EMT’ were selected for the analysis. All gene sets enriched with a p value < 0.01 were enriched in responder samples. There were no pathways enriched in the control samples. D Heatmap showing differentially expressed genes between control and responder FaDu samples with a p value < 0.1. The genes corresponding to p-EMT genes are from [Ref. 42]. The corresponding GSEA plot is shown in Fig. S3D. GSEA plots are shown for selected pathways enriched with differentially expressed genes (Table S4) between control and responder FaDu E and H460 F samples. NES and padj (p-adjusted) values for the specific pathway are indicated on each plot. The corresponding heatmaps are shown in Fig. S4 (FaDu) and S5 (H460)
Fig. 3
Fig. 3
High intratumoral densities of neutrophils and bacteria are associated with a mesenchymal tumor phenotype and nodal metastasis. Tumor tissues from 54 SCCHN patients (cohort 1, Table S1) were stained with fluorescent antibodies against CD66b (neutrophils) and vimentin (mesenchymal marker). Bacteria were visualized via Pappenheim staining. The quantification of cell density and median fluorescence intensity (MFI) was performed on tumor island areas, which are displayed as color codes A or grouped into regions of high and low bacterial B or high and low neutrophil C density. D A representative IF image of CD66b and vimentin staining of total tumor tissue is depicted in the upper panel; an example of Pappenheim staining used to detect bacterial colonization (red arrows) is shown in the lower panel. E Tumor tissue from 65 HNC patients (cohort 2, Table S2) was stained for intratumoural neutrophils and grouped according to nodal metastasis status (gray for cN0 and yellow for cN+ ). FM Patients without lymph node metastasis (cN0, 4 patients) and with positive node status (cN+, 6 patients) were selected for further analysis. Consecutive slides were prepared and stained with an RNAscope for the 16S ribosomal unit to detect bacterial RNA and with fluorescent antibodies directed against CD66b (neutrophils), pancytokeratin (PanCK, tumor cells), Ki67 (proliferative cells), and vimentin (mesenchymal marker). F, G Quantification of the frequencies of the indicated markers per patient is shown according to metastasis status. H Representative spatial plots showing the spatial distribution of total cells (DAPI+, gray), tumor cells (PanCK+, green), vimentin-expressing cells (Vim+, red), proliferative cells (Ki67+, orange), nonproliferative tumor cells expressing vimentin (PanCK+Vim+Ki67-, blue) and neutrophils (CD66b+, pink). Spatial plots were generated via HALO AI®. I Quantification of neutrophil density (CD66b+) according to bacterial (16S+) enrichment in SCCHN tissue samples. For this analysis, 5 patients were selected, and regions with high or low bacterial loads were analyzed (51 high-bacteria ROIs and 49 low-bacteria ROIs). JL Quantification of the indicated markers in regions with high or low bacterial loads (41 high bacterial ROIs and 31 low bacterial ROIs) from selected patients with (cN+, 6 patients) and without lymphatic metastasis (cN0, 4 patients). M Representative spatial plots showing the spatial distribution of bacterial RNA (16S+), tumor cells (PanCK+, green), vimentin-expressing cells (Vim+, red), proliferative cells (Ki67+, orange), nonproliferative tumor cells expressing vimentin (PanCK+Vim+Ki67-, blue) and neutrophils (CD66b+, pink). Spatial plots were generated via HALO AI®. Statistical analysis was performed via the nonparametric Kruskal‒Wallis test, followed by Dunn’s multiple comparisons test or the t test/Mann‒Whitney test: *p < 0.05, **p < 0.01, ****p ≤ 0.0001. The data are displayed as the means or medians, with symbols representing patients BG or intratumoral regions IL
Fig. 4
Fig. 4
Bacterial stimulation enhances the migratory and invasive abilities of tumor cells. A description of the supernatants can be found in Table S3. A Control and stimulated FaDu cells were grown until confluence. Closure of a scratch was recorded after 24 h. The closure area was quantified with ImageJ; n = 11. B Ki67 expression in stimulated and unstimulated tumor cells was determined via immunofluorescence staining (control/SAFP, n = 8; FP, n = 3). CE In ovo CAM assays: Stimulated tumor cells were inoculated onto the upper CAM (control n = 20, FP n = 12, SAFP n = 27). Macromorphology, tumor weight C, and angiogenesis D were recorded on day 3 postinoculation. E GFP-labeled, stimulated FaDu cells were injected into the main CAM vein of a developing chicken embryo. After 5 days, fluorescent tumor cells (marked by white arrows) in the punches obtained from the lower CAM were counted (control n = 23, SAFP n = 27). F, G Tumor cells were cultured in control medium or stimulated with either SAFP or SAHP for 72 h. The supernatant was removed, and the cells were reseeded as indicated. Increased cell growth after removal of the “inducer” supernatant was observed (n = 3). A, B, F, G n indicates the number of independent experiments, CE n indicates the number of eggs used in the experiment. AF Statistical analysis was performed with an unpaired t test A, B, E, F and one-way ANOVA with Tukey’s multiple comparisons test C, D: *p < 0.05, ** p < 0.01, *** p < 0.001, **** p ≤ 0.0001. The data are displayed as the means ± SDs
Fig. 5
Fig. 5
Bacterial stimulation of tumor cells induces PMN activation. A description of the supernatants can be found in Table S3. A Exemplary scheme of PMN stimulation: Upper part: Control PMNs (unstimulated) were treated with the supernatant of untreated FaDu cells (FaDu (F)); lower part: PMNs were treated with supernatant from bacteria-stimulated tumor cells (SAFs). Supernatants from 20 h stimulated or unstimulated PMNs were harvested, and the concentrations of MIF B and IL-8 C were determined via ELISA, n = 6. D PMNs were stimulated for 3 h, and ROS production was determined via 123Dihydrorhodamine and flow cytometry, n = 6. E PMNs were stimulated for 24 h, and the number of dead cells was determined via AnnexinV/7AAD staining and flow cytometry, n = 6. Supernatants from PMNs stimulated for 20 h under the indicated conditions were harvested, and the concentration F and activity G of NE were determined, n = 1–6. H NET formation was analyzed in PMNs stimulated for 30 min with different supernatants. The release of myeloperoxidase (MPO, green) and citrullinated histone 3 (CitH3, orange) was detected by immunofluorescence to confirm NET formation, n = 3. I, J PMNs were stimulated with the designated supernatants for 30 min and subsequently added to tumor cells on an E-plate. The proliferation of tumor cells was monitored with xCELLigence for 72 h, n = 3. Tumor tissues from ten SCCHN patients (also shown in Fig. 3F–H) were stained for CD66b (neutrophils), neutrophil elastase (NE) and matrix metalloproteinase-9 (MMP-9). Patients were grouped according to their nodal metastasis status (gray for cN0 and yellow for cN+  ); the frequencies of neutrophils expressing NE (CD66b+NE+) K, MMP-9 (CD66b+MMP-9+) L, and both markers (CD66b+NE+MMP-9+) M in the tumor tissue were quantified. N Representative spatial plots showing the distribution of total cells (DAPI+, gray), neutrophils (CD66b+, pink), and neutrophils expressing NE (CD66b+NE+, orange), MMP-9 (CD66b+MMP-9+, green), or both markers (CD66b+NE+MMP-9+, red). OT Frequencies (as a percentage of total DAPI+ cells) of neutrophils expressing NE (CD66b+NE+), MMP-9 (CD66b+MMP-9+), or both markers (CD66b+ NE+MMP-9+) in SCCHN tissue are shown according to bacterial (16S+) enrichment. For this analysis, regions showing high and low bacterial colonization were analyzed (41 high bacterial ROIs and 31 low bacterial ROIs). U Representative spatial plots showing the spatial distribution of bacterial RNA (16S+), neutrophils (CD66b+, pink), neutrophils expressing NE (CD66b+NE+, orange), MMP-9 (CD66b+MMP-9+, green), and both markers (CD66b+ NE+MMP-9+, red) in regions with high or low bacterial loads. BE, H n indicates the number of independent PMN donors tested. F, G n indicates the number of independent technical replicates. I, J n indicates the number of independent experiments and PMN donors. KM Each symbol represents one patient. OT Each symbol represents one unique intratumoral region. All the statistical analyses were performed via unpaired t tests: *p < 0.05, ** p < 0.01, *** p < 0,001, **** p ≤ 0.0001. The data are displayed as the means ± SDs. Spatial plots were generated via HALO AI®
Fig. 6
Fig. 6
SAFP-stimulated mesenchymal tumor morphotypes are resistant to NK cytotoxicity. A description of the supernatants can be found in Table S3. A Unstimulated tumor cells (16 mice total) or tumor cells stimulated with SAFP supernatant (15 mice total) were injected into the floor of the mouth of nude mice. After 20 days, the mice were sacrificed, and the percentage of mice with lymph node metastases was determined. The mice were treated either with normal rabbit serum (control) or with an anti-asialo GM1 antibody for the depletion of NK cells. B Tumor cells were stimulated with supernatants for 72 h, IL-2-stimulated NK cells were added for 24 h, and NK cell-mediated tumor cell death was determined via an AnnexinV/7AAD flow cytometry assay (FaDu: control, n = 20; SAFP, n = 22; H460: control; SAHP, n = 3). C Tumor cells were stimulated with supernatants for 72 h, and NK cells were stimulated with IL-2 for 48 h. Afterwards, both cell types were fluorescently labeled and placed together to form conjugates, which were tracked via flow cytometry (FaDu n = 7, H460 n = 6). D Tumor cells were stimulated with supernatants for 72 h (with the addition of DNase I or Sivelestat during supernatant production), IL-2-stimulated NK cells were added for 24 h, and tumor cell killing was determined via an AnnexinV/7AAD flow cytometry assay (DNase I experiment, n = 3; Sivelestat experiment, n = 5). A Numbers of metastatic mice and total mice per group are indicated. BD n indicates the number of experiments, each with an independent NK cell donor. Statistical analysis for all experiments was performed with an unpaired t test: *p < 0.05, ** p < 0.01. The data are displayed as the means ± SDs

References

    1. Coffelt SB, Wellenstein MD, de Visser KE. Neutrophils in cancer: neutral no more. Nat Rev Cancer. 2016;16:431–46. - PubMed
    1. Houghton AM, Rzymkiewicz DM, Ji H, Gregory AD, Egea EE, Metz HE, et al. Neutrophil elastase-mediated degradation of IRS-1 accelerates lung tumor growth. Nat Med. 2010;16:219–23. - PMC - PubMed
    1. Lerman I, Garcia-Hernandez ML, Rangel-Moreno J, Chiriboga L, Pan C, Nastiuk KL, et al. Infiltrating myeloid cells exert protumorigenic actions via neutrophil elastase. Mol Cancer Res. 2017;15:1138–52. - PMC - PubMed
    1. Lerman I, Hammes SR. Neutrophil elastase in the tumor microenvironment. Steroids. 2018;133:96–101. - PMC - PubMed
    1. Chang C, Werb Z. The many faces of metalloproteases: cell growth, invasion, angiogenesis and metastasis. Trends Cell Biol. 2001;11:S37–43. - PMC - PubMed

Substances