. 2025 Mar 28;9(1):91.
doi: 10.1038/s41698-025-00854-4.

A complex phylogeny of lineage plasticity in metastatic castration resistant prostate cancer

Affiliations

A complex phylogeny of lineage plasticity in metastatic castration resistant prostate cancer

Jones T Nauseef et al. NPJ Precis Oncol. .

Abstract

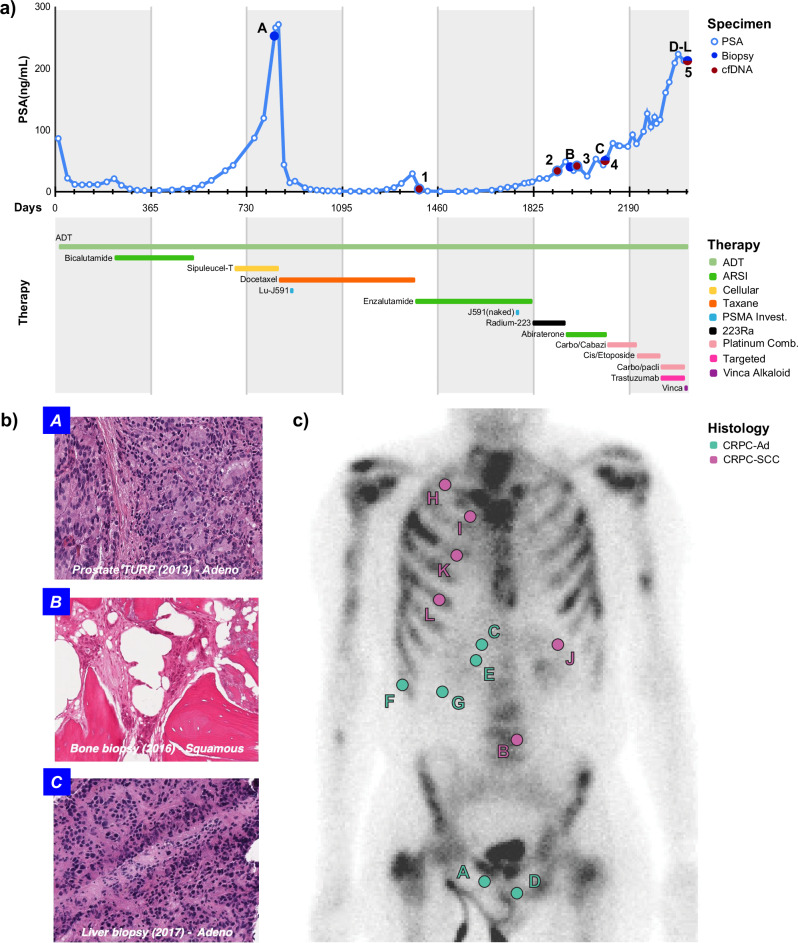
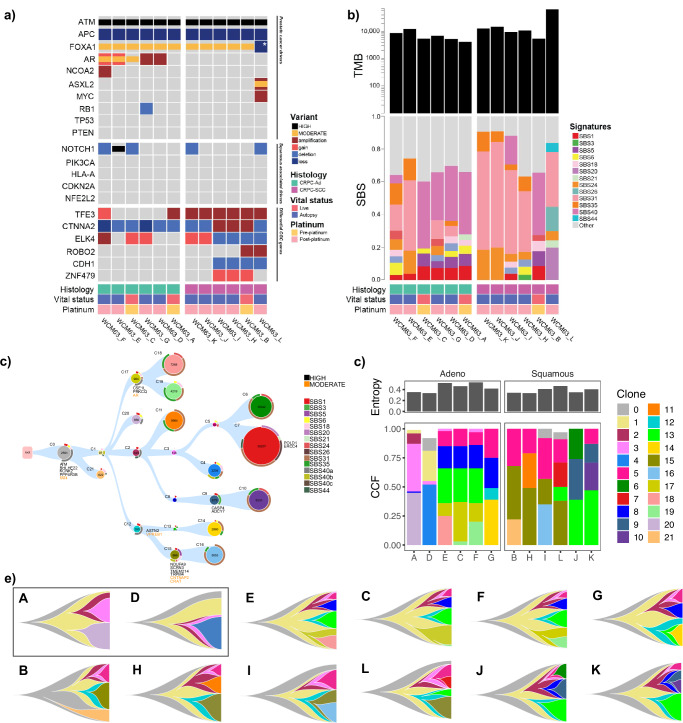
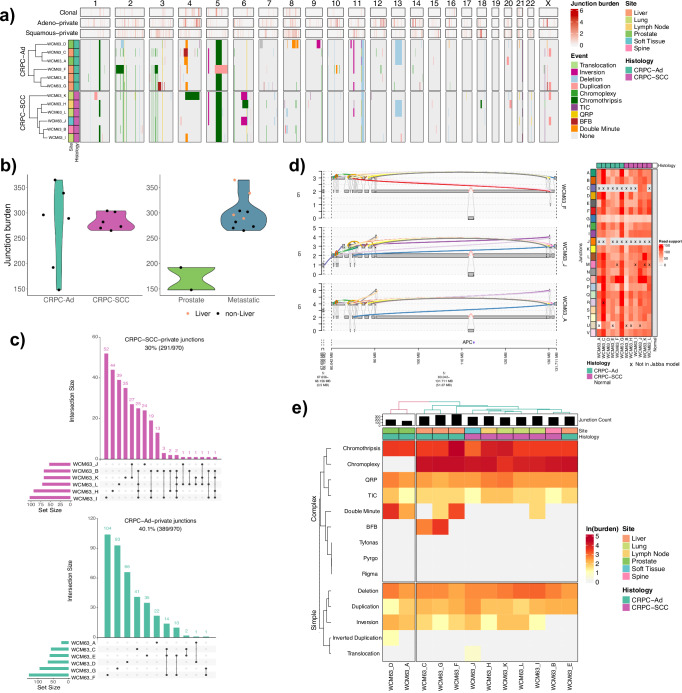
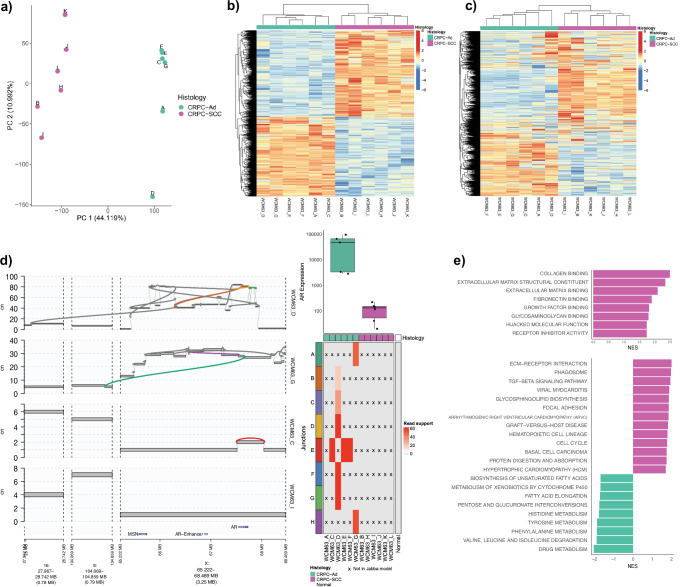
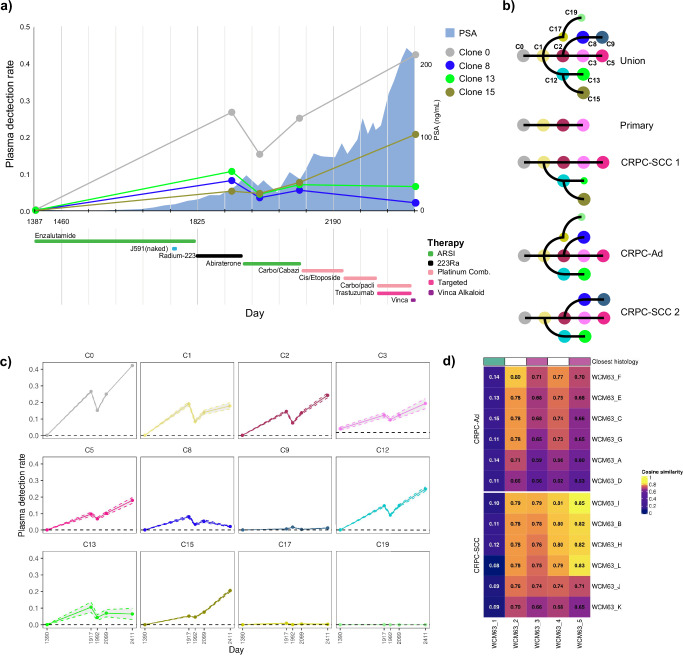
Aggressive variant and androgen receptor (AR)-independent castration resistant prostate cancers (CRPC) represent the most significant diagnostic and therapeutic challenges in prostate cancer. This study examined a case of simultaneous progression of both adenocarcinoma and squamous tumors from the same common origin. Using whole-genome and transcriptome sequencing from 17 samples collected over >6 years, we established the clonal relationship of all samples, defined shared complex structural variants, and demonstrated both divergent and convergent evolution at AR. Squamous CRPC-associated circulating tumor DNA was identified at clinical progression prior to biopsy detection of any squamous differentiation. Dynamic changes in the detection rate of histology-specific clones in circulation reflected histology-specific sensitivity to treatment. This dataset serves as an illustration of non-neuroendocrine transdifferentiation and highlights the importance of serial sampling at progression in CRPC for the detection of emergent non-adenocarcinoma histologies with implications for the treatment of lineage plasticity and transdifferentiation in metastatic CRPC.


Conflict of interest statement

Competing interests: JTN reports consulting or advising relationships with Pfizer, Bayer, and AIQ. At the time of publication, he is an employee of Convergent Therapeutics.

Figures

Fig. 1
Fig. 1. Clinical and pathological summary of patient’s course.
a Plot of patient’s PSA (ng/mL) from time of initial systemic therapy until death. The small white circles indicate PSA samples, the large blue circles indicate tumor biopsies, and the red circles indicate cfDNA samples. The bottom track shows timing, duration, and type of therapies. b Histopathology of WCM63, primary and metastatic sites. A. Transurethral resection of prostate (TURP) in 2013 shows adenocarcinoma in the primary site. B. Biopsy of bone in 2016 shows metastatic carcinoma with squamous differentiation. C. Liver biopsy in 2017 shows metastatic prostatic adenocarcinoma. (Hematoxylin and eosin stain, 200x original magnification. Freeze artifact present in C). c Anatomical sites of disease colored by histology.
Fig. 2
Fig. 2. Analysis of genomic alterations, mutational signatures, and phylogenetic reconstruction demonstrating the clonality of disparate histologies.
a Oncoprint summarizing the presence of common prostate driver alterations. Row groups show the most common (i) prostate cancer driver alterations, (ii) squamous drivers and (iii) differentially altered genes between squamous and adenocarcinoma histologies among consensus pan-cancer genes. Histology, vital status, and whether the patient had received chemotherapy at time of biopsy are indicated below. Gains and deletions are restricted to focal events no larger than 3 megabases in size. The asterisk indicates a 4.5 megabase deletion that resulted in loss of a truncal FOXA1 mutation in WCM63_L. b Summary of mutational signatures. The top row corresponds to the number of somatic SNV/indels, represented in log10 scale. The middle row represents the proportion of the most representative COSMIC SBS signatures. Histology, vital status, and whether the patient had received chemotherapy at time of biopsy are indicated below. c Phylogenetic clone tree constructed using single nucleotide variants (SNVs) and insertion/deletion variants (INDELs) supports a common cancer cell progenitor of the prostate. Each node represents a clone, and the number of variants unique to a given clone are overlaid. The circle graphs surrounding each node indicate the COSMIC SBS mutational signature proportions for the variants in that clone. Clone IDs are shown just outside each node, as well as any known oncogenes affected by variants in each clone. The text color of each gene name indicates whether it is affected by a moderate or high-impact mutation, as inferred by the Ensembl Variant Effect Predictor. d Stacked bar plots indicating clone-level cancer cell fractions (CCF) for each sample. Samples are grouped by histology, and the top track shows the Shannon entropy of the clone CCFs for each sample. e Schematic showing inferred tumor evolution over time for each sample, given the phylogenetic tree describing the evolutionary relationship between clones, and the clone CCFs at the time of sequencing. CRPC-Ad samples are shown in the top row, and CRPC-SCC are shown in the bottom row. A box is drawn around the two prostate samples.
Fig. 3
Fig. 3. Comprehensive description of structural variant (SV) landscape supports shared lineage.
a The landscape of simple and complex structural variants, summarized in 1 megabase windows across the genome. The top three tracks represent clonal (read support in all samples), adenocarcinoma-private (no read support in all squamous samples), and squamous-private (no read support in all adenocarcinoma samples) structural variant junctions. The bottom two tracks display the sample-level genomic footprint of structural variants as classified by JaBbA. Rows were clustered within histology via complete linkage clustering, using the Hamming distance metric. b Violin plots of junction burden summarized by histological subtype (L) and site of samples (R). c UpSet plots of sample presence and absence among histology-private junctions. The left-most bar plot represents the total histology-private junction burden of each sample. The top bar plot represents the magnitude of each set overlap, as indicated by the connected dots. d Example of a chromothripsis event shared across all adenocarcinoma and squamous tumors. The left panel is a genome-level view of the event for three representative samples. The gray bars represent genomic intervals, and the height of the bars indicate their copy number. The multicolored arcs indicate the somatic junctions comprising the event. These colors align to the heatmap on the right, which indicates read support for each junction/sample combination. Cells are colored by read support, and are marked with an “x” if that particular junction was not integrated into that sample’s JaBbA model. e Heatmap of complex and simple SV junction burdens. Columns represent each sample, and rows represent SV classifications. Simple and complex SVs were clustered separately via complete linkage clustering using Euclidean distance. Samples were clustered in the same manner, but cut into two groups as determined by the dendrogram.
Fig. 4
Fig. 4. Analysis of RNA-seq reveal disparate transcriptional programs but no causative demonstration of driver of transformation.
a First two principal components of a PCA of gene expression after correction for disparate processing. Axis labels indicate the percentage of explained variance for each principal component. Points are colored by histology. b Heatmap showing differentially expressed genes (DEG) between histologies (padj < 0.01). c Heatmap showing the 4889 most variable genes, where the samples group by histology after unsupervised hierarchical clustering. The 4889 most variable genes were selected on the basis of their standard deviation across all samples, to match the number of differentially expressed genes (DEGs). d Convergent evolution of adenocarcinoma copy number gain and resultant increase in expression of AR. The left panel is a genome-level view of the AR locus for four representative samples. The top three samples display different routes of AR copy number gain in CRPC-Ad samples, and the bottom sample is a representative CRPC-SCC with no copy number gain. The gray bars represent genomic intervals, and the height of the bars indicate their copy number. The multicolored arcs indicate the somatic junctions within 100 Kb of AR, and the gray arcs represent somatic junctions more than 100 Kb away from AR. These colors align to the heatmap on the right, which indicates read support for each junction/sample combination. Cells are colored by read support, and are marked with an “x” if that particular junction was not integrated into that sample’s JaBbA model. e Gene set enrichment analysis (GSEA) results using the Gene Ontology molecular function (top) and KEGG (bottom) reference databases. A positive normalized enrichment score (NES) corresponds to pathways significantly (p < 0.05) enriched by genes that are up-regulated in squamous samples and down-regulated in adenocarcinoma samples, while a negative NES corresponds to pathways that are up-regulated in adenocarcinoma samples and down-regulated in squamous samples.
Fig. 5
Fig. 5. Circulating mutational burden in ctDNA reflects early detection of transformed histology.
a Plasma detection rate of selected clones over time, juxtaposed with PSA levels and treatment regimen. The left y-axis corresponds to the plasma detection rate shown by each of the lines, and the right y-axis corresponds to the blue area plot of PSA levels as measured in ng/ml. The bottom track shows the timing, duration, and type of therapies. b Schematic of the phylogenetic tree, restricted to clones shared across more than one sample. Each panel represents a subset of the tree as it relates to specific sample lineages, labeled to the right of each tree. The size of each node indicates how many samples a clone is detected in. c Plasma detection rate of all non-private clones over time, corresponding to the clones in the top-most tree in the preceding (b). The shaded polygon and colored dashed lines represent the 95% bootstrap confidence intervals of the detection rate, and the black dashed line represents the clone-specific lower limit of detection. d Heatmap showing the similarity of plasma and tumor copy number profiles as measured by the cosine similarity of normalized read depth. Tumor samples are represented by each row, and cfDNA samples are measured on each column. Samples are grouped by histology. The color of each cell, and the annotated value indicate cosine similarity, The top track indicates which histology was more similar to the cfDNA at a given time point, as measured by a greater cosine similarity (P < 0.05, Welch Two Sample t-test).

References

    1. Liu, W et al. Copy number analysis indicates monoclonal origin of lethal metastatic prostate cancer. Nat. Med.15, 559–565 (2009). - PMC - PubMed
    1. Woodcock, DJ et al. Prostate cancer evolution from multilineage primary to single lineage metastases with implications for liquid biopsy. Nat. Commun.11, 5070 (2020). - PMC - PubMed
    1. Davies, A et al. An androgen receptor switch underlies lineage infidelity in treatment-resistant prostate cancer. Nat. Cell Biol.23, 1023–1034 (2021). - PMC - PubMed
    1. Labrecque, MP et al. Molecular profiling stratifies diverse phenotypes of treatment-refractory metastatic castration-resistant prostate cancer. J. Clin. Investig.129, 4492–4505 (2019). - PMC - PubMed
    1. Pisapia, D. J. et al. Next-generation rapid autopsies enable tumor evolution tracking and generation of preclinical models. JCO Precis. Oncol.1, 1–13 (2017). - PMC - PubMed

LinkOut - more resources