. 2025 Mar 29;16(1):3057.
doi: 10.1038/s41467-025-58228-0.

Ultrafast fMRI reveals serial queuing of information processing during multitasking in the human brain

Affiliations

Ultrafast fMRI reveals serial queuing of information processing during multitasking in the human brain

Qiuhai Yue et al. Nat Commun. .

Abstract

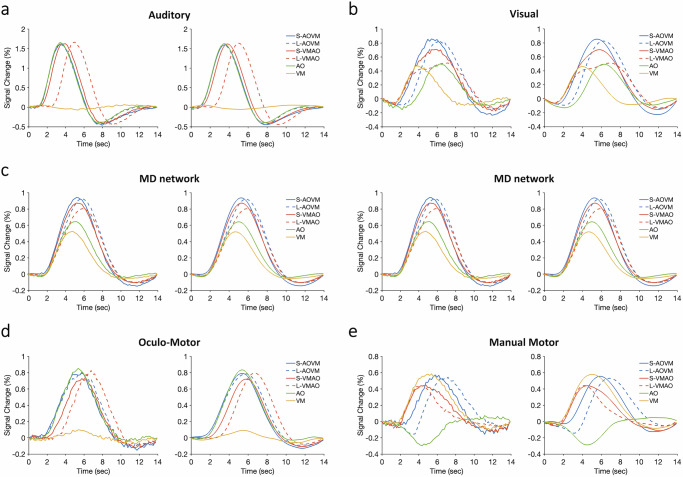
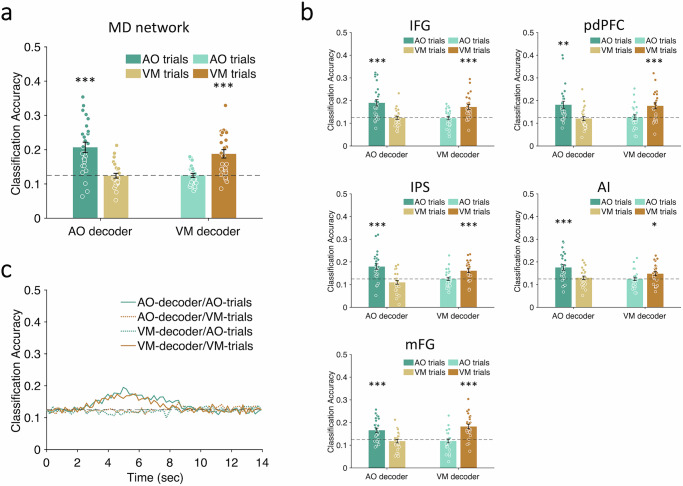
The human brain is heralded for its massive parallel processing capacity, yet influential cognitive models suggest that there is a central bottleneck of information processing distinct from perceptual and motor stages that limits our ability to carry out two cognitively demanding tasks at once, resulting in the serial queuing of task information processing. Here we used ultrafast (199 ms TR), high-field (7T) fMRI with multivariate analyses to distinguish brain activity between two arbitrary sensorimotor response selection tasks when the tasks were temporally overlapping. We observed serial processing of task-specific activity in the fronto-parietal multiple-demand (MD) network, while processing in earlier sensory stages unfolded largely in parallel. Moreover, the MD network combined with modality-specific motor areas to define the functional characteristic of the central bottleneck at the stage of response selection. These results provide direct neural evidence for serial queuing of information processing and pinpoint the neural substrates undergirding the central bottleneck.


Conflict of interest statement

Competing interests: The authors declare no competing interests.

Figures

Fig. 1
Fig. 1. Experimental design and behavioral results.
a In the Auditory-Oculomotor (AO) task, participants responded to one of eight auditory sounds by moving their eyes from a central fixation to one of eight possible target positions (marked by place holders) and maintaining the target eye position until a release stimulus appeared 1500 ms later, instructing them to return eye gaze to the central fixation point; (b) In the Visual-Manual (VM) task, participants responded to one of eight visual colors by pressing one of eight possible buttons, each assigned to a specific finger except for the two thumbs; (c) In the dual-task conditions, the order of the two tasks (AO-VM or VM-AO) and stimulus-onset asynchrony (SOA, 300 msec or 1500 msec) were varied across trials; (d) In-scanner behavioral results show response times for the single-task and dual-task conditions: In AOVM trials, RT2 = 1662 ms at short SOA vs. 1120 ms at long SOA, t(25) = 21.49, p = 1.23 × 10−17, N = 26, paired-sample t-test, two-tailed; in VMAO, RT2 = 1548 ms at short SOA vs. 1025 ms at long SOA, t(25) = 15.17, p = 4.04 × 10−14, Long SOA RTs were not different from single-task RTs (long SOA AOVM RT2 vs. VM RT = 1103 ms, t(25) = 0.57, p = 0.57; long SOA VMAO RT2 vs. AO RT = 1028 ms, t(25) = 0.22, p = 0.83); (e) Response times for the single-task and dual-task conditions combined across two task orders. In dual-task conditions, RT2 = 1607 ms at short SOA vs. 1072 ms at long SOA, t(25) = 23.75, p = 1.13 × 10−18, N = 26, paired-sample t-test, two-tailed. The Long SOA RT2 was not different from Single-Task RT = 1066 ms (long SOA RT2 vs. single, t(25) = 0.36, p = 0.72). Long SOA RT1(1056 ms) was not different from single RT, t(25) = 1.56, p = 0.13). Error bars represent the standard error of the mean. Source data are provided as a Source Data file.
Fig. 2
Fig. 2. Sensory, motor and multimodal regions of interest.
a Sound presentations in the single AO task activated auditory cortex around the bilateral HG/A1; (b) Color presentations in the single VM task activated visual cortex centered in bilateral putative V1–V4; (c) Moving eyes to target positions in the single AO task activated bilateral FEF as well as a large cluster covering bilateral parietal and occipital areas (including V1); (d) Pressing buttons in the visual VM task activated bilateral precentral (including M1) and postcentral gyri, as well as bilateral Rolandic areas. The sensory and motor ROIs are reported based on a threshold at voxel level of p < 0.001, and corrected at cluster level α < 0.01, with cluster size >55 voxels. e The conjunction analysis revealed activations in bilateral IFG, bilateral pdPFC, bilateral IPS, bilateral AI and bilateral mFG/dAC, corresponding to the multiple demand (MD) network. The conjunction ROIs are reported based on a threshold voxel level of p < 0.001, corrected at cluster level α < 0.01, with cluster size >62 voxels. HG Heschl’s gyri, A1 primary auditory cortex, FEF frontal eye field, M1 primary motor cortex, IFG inferior frontal gyri, pdPFC posterior dorsal prefrontal cortex, IPS intraparietal sulcus, AI anterior insula, mFG/dACC medial frontal gyri/dorsal anterior cingulate cortex, AO auditory-oculomotor, VM visual-manual.
Fig. 3
Fig. 3. BOLD univariate activation timecourses in single- and dual-task trials.
Group-averaged timecourses of % signal change from the onset of T1 (0 ms) in short-SOA AOVM (solid blue), long-SOA AOVM (dashed blue), short-SOA VMAO (solid red), long-SOA VMAO (dashed red), single AO (green) and single VM (yellow) trials in (a) auditory cortex, (b) visual cortex (V1–V4), (c) multiple-demand (MD) cortical network, (d) oculomotor cortex (FEF), and (e) manual motor cortex (M1). The left columns show the raw results and the right columns show the fitted curves of the data. FEF frontal eye field, M1 primary motor cortex, SOA stimulus-onset asynchrony, AO auditory-oculomotor, VM visual-manual. Note that the MD network timecourses (c) have been duplicated on the left and right sides of the figure to facilitate comparison of their activation profiles to the sensory and motor areas of the AO and VM tasks. Source data are provided as a Source Data file.
Fig. 4
Fig. 4. Single-task multivariate decoding in sensory and motor ROIs.
a Auditory cortex; (b) visual cortex; (c) oculomotor cortex; and (d) manual motor cortex. The upper graph in each panel shows the group-averaged classification accuracy in the single task trials with color-filled dots representing individuals’ data. The x-axis represents task-specific classifiers and colors represent different single-task trial types. The darker colors represent the congruous decoder-trial type pairs whereas the lighter colors represent the incongruent pairs. a Auditory cortex (AO decoding between AO trials, p = 1.29 × 10−9); (b) visual cortex (VM decoding between VM trials, p = 3.71 × 10−5; AO decoding between AO trials, p = 5.18 × 10−5); (c) oculomotor cortex (AO decoding between AO trials, p = 0.006); (d) manual motor cortex (VM decoding between VM trials, p = 4.18 × 10−11). All statistical tests in ad are one-sample t-tests, one-tailed, FDR corrected, N = 26. The lower graph in each panel shows the average classification accuracy time series in the single tasks, with the solid lines representing task-specific decoding for the congruous trial type and dashed lines representing results for the incongruous trial type. Dashed gray lines represent chance levels (12.5%). Error bars represent the standard error of the mean. Asterisks indicate the significance of the decoding against the chance level; **p < 0.01, ***p < 0.001. AO auditory-oculomotor, VM visual-manual. Source data are provided as a Source Data file.
Fig. 5
Fig. 5. Single-task decoding in the Multiple-Demand (MD) network.
The average classification accuracies in the single-task trials in (a) MD network (AO decoding between AO trials, p = 2.06 × 10−5; VM decoding between VM trials, p = 2.34 × 10−5) and (b) individual bilateral ROIs of the MD network (in IFG, AO decoding between AO trials, p = 1.24 × 10−4, VM decoding between VM trials, p = 1.24 × 10−4; in pdPFC, AO decoding between AO trials, p = 0.0013, VM decoding between VM trials, p = 8.55 × 10−4; in IPS, AO decoding between AO trials, p = 1.67 × 10−4, VM decoding between VM trials, p = 1.67 × 10−4; in AI, AO decoding between AO trials, p = 5.18 × 10−4, VM decoding between VM trials, p = 0.015; in mFG/dACC, AO decoding between AO trials, p = 1.69 × 10−4, VM decoding between VM trials, p = 1.21 × 10−5). All statistical tests in (a, b) are one-sample t-tests, one-tailed, FDR corrected, N = 26. Color-filled dots represent individuals’ data. c Group-averaged classification accuracies time series in the single task trials in the MD network. Labels and axes are as described in Fig. 4 legend. IFG inferior frontal gyri, pdPFC posterior dorsal prefrontal cortex, IPS intraparietal sulcus, AI anterior insula, mFG/dACC medial frontal gyri/dorsal anterior cingulate cortex. Error bars represent the standard error of the mean. Asterisks indicate the significance of the decoding against chance level; *p < 0.05, **p < 0.01, ***p < 0.001. AO auditory-oculomotor, VM visual-manual. Source data are provided as a Source Data file.
Fig. 6
Fig. 6. Time courses of single-task and dual-task decoding in sensory and motor areas.
Group-averaged classification accuracy time series in the single-task and dual-task trials in (a) auditory cortex and (b) manual motor cortex. The upper graphs in each panel show the results for the short SOA conditions and the lower graphs for the long SOA conditions. The left columns show the raw decoding results and the right columns show the fitted curves of the decoding data. Blue lines show task-specific decoding results for T1 in the dual-task conditions and red lines show task-specific decoding results for T2 in the dual-task conditions. Green lines show AO-specific decoding for the single AO task in (a) auditory cortex and yellow lines show VM-specific decoding for the single VM task in (b) manual motor cortex. Dashed gray lines represent chance levels (12.5%). Vertical dashed lines indicate onset/peak latencies in single-task and dual-task trials. Asterisks indicate significantly earlier T1 decoding peak latency in the short-SOA dual-task trials (marked by the blue vertical line) relative to the single-task trials (marked by the green vertical line) in (a) auditory cortex (**p = 0.0013, N = 26, paired-sample t-test, two-tailed), and significantly postponed T2 decoding peak/onset latency in the short-SOA dual-task trials (marked by the red vertical line) relative to the single-task trials (marked by the yellow vertical line) in (b) manual-motor cortex (peak latency, ***p = 1.6 × 10−4, N = 26, paired-sample t-test, two-tailed; onset latency, ***p = 7.8 × 10−5, N = 26, paired-sample t-test, two-tailed). Note that the raw timecourses in the left panels could only be shifted by multiples of TRs to the nearest SOAs (199 ms and 1393 ms) whereas the curve-fitted data could be shifted by the exact SOAs (300 ms and 1500 ms). SOA stimulus-onset asynchrony, AO auditory-oculomotor, VM visual-manual. Source data are provided as a Source Data file.
Fig. 7
Fig. 7. Time courses of single-task and dual-task decoding in the MD network.
a The group-averaged classification accuracy time series in the MD network. The upper graphs show results of task-specific decoding for the short-SOA dual-task trials and the lower graphs for the long-SOA dual-task trials. The left column shows the raw decoding results and the right column shows the fitted curves of the decoding results. Dashed gray lines represent the chance levels (12.5%) and the colored vertical dashed lines indicate decoding peak latencies and onset latencies. b Correlations between individuals’ fMRI decoding measures (peak latency and onset latency) and magnitude of the behavioral PRP (RT2 difference between short- and long-SOA dual-task conditions). Hollow dots represent individual data. The red line represents a linear fit and the shaded ribbon represents the standard error. Asterisks indicate significantly postponed T2 decoding peak latencies and onset latencies in the short-SOA dual-task trials (marked by the red vertical line) relative to the single-task trials (marked by the gray vertical line): peak latency, ***p = 3.7 × 10−6, N = 26, paired-sample t-test, two-tailed; onset latency, ***p = 9.79 × 10−5, N = 26, paired-sample t-test, two-tailed. Note that the raw timecourses in the left panels could only be shifted by multiples of TRs to the nearest SOAs (199 ms and 1393 ms) whereas the curve-fitted data could be shifted by the exact SOAs (300 ms and 1500 ms). MD multiple-demand, SOA stimulus-onset asynchrony, PRP psychological refractory period. Source data are provided as a Source Data file.
Fig. 8
Fig. 8. Comparative decoding time courses in single VM and AO tasks.
Chronometry of decoding peak latency across sensory, MD network and motor areas in (a) single VM task and (b) single AO task. While the decoding timecourses peaked earlier in the sensory than in the MD network (single VM task, p = 0.0032; single AO task, p = 1.26 × 10−5, N = 26, paired-sample t-tests, two-tailed) or motor areas (single VM task, p = 0.0004; single AO task, p = 0.0016, N = 26, paired-sample t-tests, two-tailed), the latter two showed no peak latency differences (p’s > 0.4). Each subplot shows superimposed raw and curve-fitted decoding time series. Asterisks indicate significantly different decoding peak latencies between the sensory (marked by the left dashed vertical line) and the MD network areas (marked by the right dashed vertical line) and between the sensory and motor areas (marked by the dotted vertical line), **p < 0.01, ***p < 0.001. MD multiple-demand, AO auditory-oculomotor, VM visual-manual. Source data are provided as a Source Data file.
Fig. 9
Fig. 9. Single-task quartile-RT analysis.
Single-task quartile-RT results in sensory (a visual; b auditory), (c, d) MD network, and motor (e manual; f oculomotor) areas for the VM (a, c, e) and AO (b, d, f) tasks. In each subplot, the upper graphs show the raw time series of BOLD signal changes (left) and their fitted curves (right) for the four quartile-RT bins. The lower graphs show individuals’ correlations between their quartile peak latency (left) and onset latency (right) differences (Q4 vs. Q1) and their quartile RT differences (Q4 vs. Q1). Hollow dots represent individuals’ data. The solid line represents a linear fit and the shaded ribbon represents the standard error. MD multiple-demand, VM visual-manual, AO auditory-oculomotor, Q1 the first quartile, Q2 the second quartile, Q3 the third quartile, Q4 the fourth quartile. Source data are provided as a Source Data file.
Fig. 10
Fig. 10. Granger causality analysis of the AO network in single-task condition.
a AO task neural network model. Green solid arrows indicate the direction of the significant causal influence of a brain area onto another tested in this analysis. Dashed arrows indicate that the direction of the causal influence is not significant. b Granger causality estimates for each of the pairwise directional connections during the AO and the VM tasks in the AO neural network (from A to MD, p = 0.002; from MD to O, p = 0.02; from O to MD, p = 0.0005; from A to O, p = 0.0003; All statistical tests are paired-sample t-tests, two-tailed, N = 26). A auditory areas, MD multiple-demand network, O oculomotor areas. Error bars represent the standard error of the mean. Asterisks represent statistically different Granger values between the AO and VM tasks; *p < 0.05, **p < 0.01, ***p < 0.001. AO auditory-oculomotor, VM visual-manual. Source data are provided as a Source Data file.

References

    1. Luo, L. Principles of Neurobiology 2nd edn (Garland Science, New York, 2020).
    1. Telford, C. W. The refractory phase of voluntary and associative responses. J. Exp. Psychol.14, 1–36 (1931).
    1. Vince, M. A. Rapid response sequences and the psychological refractory period. Br. J. Psychol.40, 23–40 (1949). - PubMed
    1. Welford, A. T. Single-channel operation in the brain. Acta Psychol.27, 5–22 (1967). - PubMed
    1. Pashler, H. Processing stages in overlapping tasks: evidence for a central bottleneck. J. Exp. Psychol. Hum. Percept. Perform.10, 358–377 (1984). - PubMed

LinkOut - more resources