. 2025 Mar 28;8(1):511.
doi: 10.1038/s42003-025-07710-y.

Cigarette smoke induces angiogenic activation in the cancer field through dysregulation of an endothelial microRNA

Affiliations

Cigarette smoke induces angiogenic activation in the cancer field through dysregulation of an endothelial microRNA

Asawari Korde et al. Commun Biol. .

Abstract

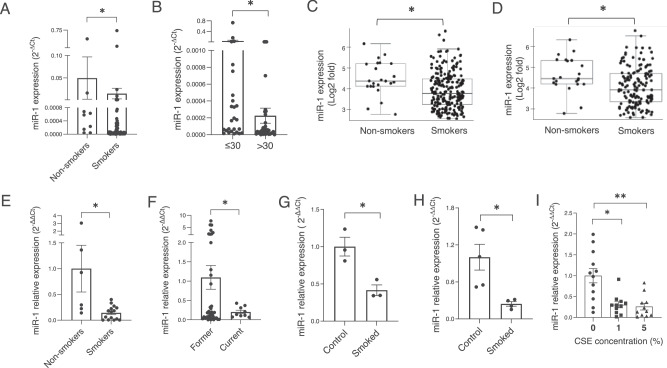
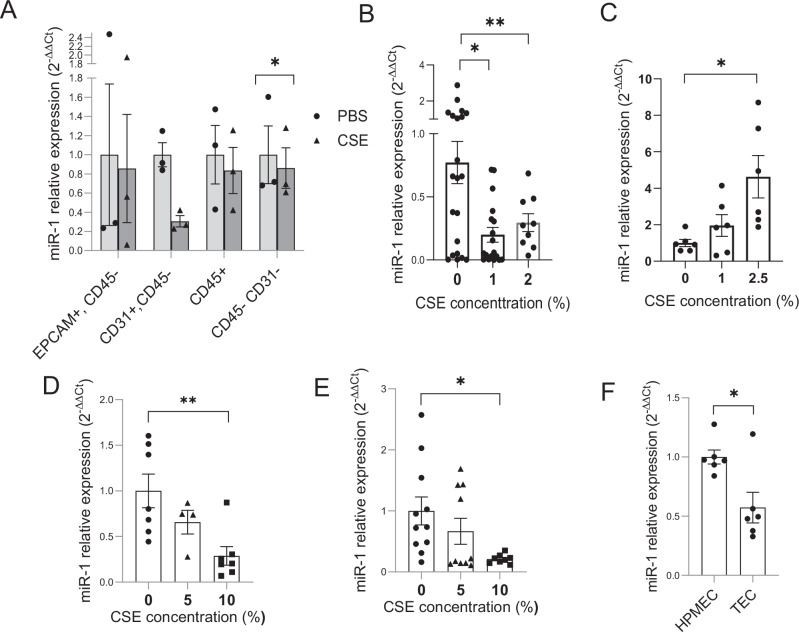
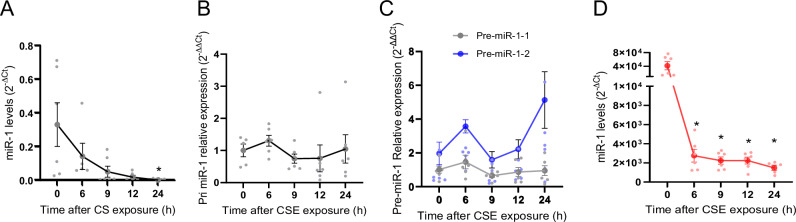
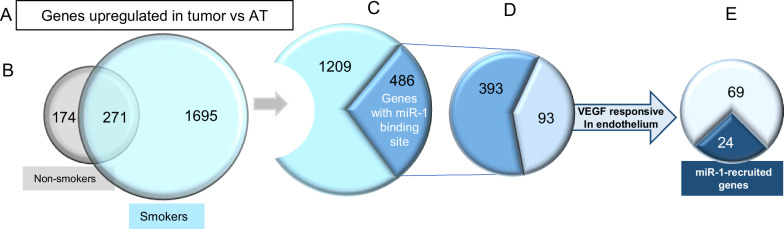
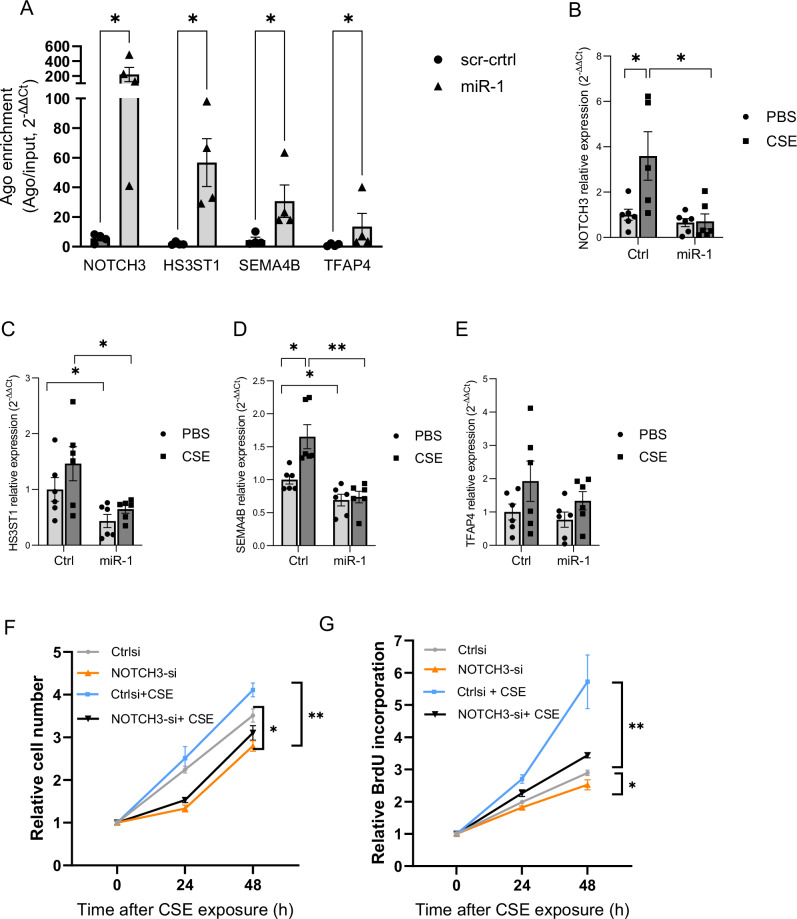
Cigarette smoke (CS) creates a "cancer field" in the lung that promotes malignant transformation. The molecular changes within this field are not fully characterized. We examined the significance of microRNA-1 (miR-1) downregulation as one of these changes. We found that tumor miR-1 levels in three non-small cell lung cancer cohorts show inverse correlations with the smoking burden. Lung MiR-1 levels follow a spatial gradient, have prognostic significance, and correlate inversely with the molecular markers of injury. In CS-exposed lungs, miR-1 is specifically downregulated in the endothelium. Exposure to CS induces angiogenesis by selectively degrading mature miR-1 via a vascular endothelial growth factor-driven pathway. Applying a multi-step molecular screen, we identified angiogenic genes regulated by miR-1 in the lungs of smokers. Knockdown of one of these genes, Notch homolog protein 3, simulates the anti-angiogenic effects of miR-1. These findings suggest that miR-1 can be used as an indicator of malignant transformation.


Conflict of interest statement

Competing interests: The authors declare no competing interests.

Figures

Fig. 1
Fig. 1. Cigarette smoke and miR-1 levels in NSCLC and non-cancerous lung.
A, B MiR-1 expression (mature miR-1/reference gene, expressed as 2−∆Ct) were measured in tumor samples from NSCLC patients (A) MiR-1 in smokers vs non-smokers (n = 9 for non-smokers and n = 63 for smokers, p = 0.0186). B MiR-1 in smokers with ≤ 30 vs >30 pack-year smoking history (n = 27 for ≤ 30 and n = 34 for >30, p = 0.012). C, D MiR-1 expression in surgically-resected NSCLC tumor samples from patients in the PROSPECT cohort was determined by array analysis (Illumina v3) and expressed as Log2-transformed values. C Comparison in all NSCLC patients (n = 246, fold = −1.47, *p = 0.004). D Comparison in adenocarcinoma (LUAD) patients (n = 170, fold change = −1.44, *p = 0.007). E MiR-1 expression in lung samples from LGRC cohort. Mature miR-1/18S levels were normalized to the mean value of the non-smokers group (control) and expressed as 2−∆∆Ct (n = 6 and 15, *p = 0.0151). F MiR-1 expression in AT tissues from former and current smokers (n = 38 and 9 respectively, *p = 0.0066). G Lungs were harvested from CC-LR (LSL-KrasG12D) mice after exposure to cigarette smoke for 2 months (smoked) or room air (control). MiR-1/reference gene levels were normalized to the mean value from the control group and expressed as 2−∆∆Ct. (n = 3 per group, p = 0.02). H Lungs were harvested from mice after 6 months of smoking (smoked) and non-exposed littermates (Control). MiR-1/reference gene levels were measured and expressed as described in (G), (n = 5 for control and 4 for smoked, *p = 0.02). I Human lung tissues were cultured ex vivo and exposed to various concentrations of CSE. MiR-1/reference gene levels were measured, normalized to the mean value of the control group(0), and expressed as 2−∆∆Ct (n = 4 patients, 3 replicates from each, *p = 0.0021 **p = 0.0014).
Fig. 2
Fig. 2. MiR-1 levels in the cancer field.
A MiR-1/ reference gene levels were measured in the tumor (T), adjacent tissue (AT), and distant tissue (DT) samples from smokers and expressed as 2−∆Ct.(n = 12 patients, p-value = 0.0048, one-way ANOVA nonparametric Friedman test). B, C T and AT samples were divided into low miR-1( < median) and high miR-1( > median) and the corresponding survivals of the patients in each group were compared using Kaplan Meier analysis (B) T-low vs T-high patients (n = 72 subjects, p = 0.0403, Log-Rank Mantel Cox test) (C) AT-low vs AT-high patients (n = 58 subjects, p = 0.0357, Log-Rank Mantel Cox test). DH The levels of miR-1 and PI3K pathway genes/reference gene were measured in AT samples (described in table S2) by qRT-PCR and expressed as Log 2−∆Ct. D Phosphatidylinositol-4,5-Bisphosphate 3-Kinase Catalytic Subunit Alpha (PI3KCA), (Spearman r = −0.3491, P = 0.0235, n = 42), (E) Growth Arrest And DNA Damage Inducible Beta (GADD45B), (Spearman r = −0.513, P = 0.0023, n = 33), (F) Forkhead box protein O1 (FOXO1), (Spearman r = −0.3232, P = 0.0419, n = 40) (G) Mechanistic Target Of Rapamycin Kinase (mTOR1), (Spearman r = −0.3499, P = 0.0394, n = 35), and (H) AKT Serine/Threonine Kinase 2 (AKT2), (Spearman r = −0.6081, P < 0.0001, n = 40).
Fig. 3
Fig. 3. CS downregulates miR-1 specifically in the endothelial cells.
A Human ex-vivo cultured lungs were treated with 1% CSE or vehicle (PBS) for 24 h, and epithelial (CD 45-, EPCAM +), endothelial (CD 45-, CD31 +), immune (CD 45 +), and double-negative (CD45−, CD31−) cells were isolated using magnetic sorting. The graph represents miR-1/reference gene levels in CSE-treated cellular fractions normalized to the levels in PBS groups and expressed as 2−∆∆Ct (n = 3 patients, *p = 0.0176). B–E Cells were treated with increasing concentrations of CSE for 24 h and miR-1/ reference gene levels were measured, normalized to the mean value of ‘0’ CSE concentration group (control), and expressed as 2−∆∆Ct (B) EA.hy926 (n = 21, 4, 18, and 9 from 4 experiments, *p = 0.0035, **p = 0.00145) (C) A549 cells (n = 6/concentration, from two experiments, *p = 0.0043) (D) HPMECs (n = 7 for 0 and 10% and 4 for 5%, from 2 experiments *p = 0.0012) (E) HUVECs (n = 11,10 and 8, from 3 experiments, *p = 0.007) (F) Endothelial cells were isolated from non-cancerous lung tissue (HPMECs) and tumor (TEC) from a lung cancer patient and cultured in growth media. miR-1/ reference gene levels were measured in total RNA from the cells, normalized to the mean levels in HPMEC group, and expressed as 2−∆∆Ct (n = 6, *p = 0.041).
Fig. 4
Fig. 4. CS downregulates miR-1 through VEGF pathway.
A NSCLC patients were grouped into non-smokers and smokers based on their smoking status and VEGF/reference gene levels were measured in the tumor samples and expressed as 2−∆Ct. (n = 9 for non-smokers and n = 57 for smokers, p = 0.0067). B Human lung tissues were cultured ex-vivo and exposed to various concentrations of CSE. VEGF/ reference gene levels were measured, normalized to the mean value of the control group(0), and expressed as 2−∆∆Ct (n = 3 subjects, 4 replicates in each. *p < 0.0001). C Human ex-vivo cultured lungs were treated with 1% CSE or vehicle (PBS) for 24 h. Endothelial (CD45− CD31+), immune (CD45+), and double-negative (CD45−, CD31−) cells were isolated using magnetic sorting. The graph represents VEGF/reference gene levels in CSE-treated cellular fractions normalized to the levels in PBS groups and expressed as 2−∆∆Ct (n = 3 patients, *p = 0.0366). D, E Endothelial cells were treated with various concentrations of CSE for 24 h and VEGF/reference gene levels were measured, normalized to the mean value of the control group(0), and expressed as 2−∆∆Ct. D HUVECs (n = 8 in each group, from 2 experiments, *p = 0.0002). E EAhy926 (n = 10 or more from 2 experiments, *p = 0.0048, **p = 0.0062). F HUVECs were exposed to 10% CSE, collected at the time points shown on the X axis, and VEGF protein levels measured by ELISA (n = 3/time point, *p < 0.0) (G) EAhy926 were starved overnight, incubated with and without a VEGFR2 blocker (sUs, and treated with 2% CSE for 24 hours. MiR-1/reference gene levels were measured, normalized to the control group, (vehicle, DMSO) and expressed as 2−∆∆Ct (n = 6 or more from 2 experiments, *p = 0.0221). H Murine lung endothelial cells (MLECs) were treated with blockers, exposed to 5% CSE, and miR-1 was measured and expressed as described in (G). (n = 4 per group, *p < 0.03).
Fig. 5
Fig. 5. The effect of CS on miR-1 biogenesis.
A–C HUVECs were exposed to increasing concentrations of CSE for 24 h. Cells were collected at the time points illustrated on the X axis and the levels of miR-1/reference gene, (A), Pri-miR-1/reference gene (B), and pre-miR-1-1 and -2/reference gene (C) were measured, normalized to the corresponding mean value at ‘0’ CSE concentration (control), and expressed as 2−∆∆Ct. (n = 5 /time point, *p < 0.01). D HUVECs were transfected with a mature miR-1 mimic (22nt). Twenty-four hours after transfection cells were exposed to CSE and miR-1 levels were measured at various time points as described in (A). (n = 5 /time point, *p < 0.05).
Fig. 6
Fig. 6. The role of miR-1 in CS-induced angiogenesis.
A EA.hy 926 were transfected with miR-1 or scrambled control RNA (ctrl) and exposed to 1% CSE for the indicated times. Cell numbers were determined and normalized to values at time ‘0’ (n = 6 from 2 experiments, *p = 0.039). B HUVECs were transfected with miR-1 (or ctrl) treated with CSE and phospho- and total- ERK and beta-actin visualized by Western blot. The top and bottom lines in the marker lane represent 50 and 37 KD bands. C, D Cells were transfected with antagomiRs (amiR-1 or control RNA, actrl), treated with CSE, and relative cell numbers measured as described in (A). C EA.hy 926 (n = 6, *p = 0.0022) (D) HUVECs (n = 9 from 2 experiments, *p = 0.011).
Fig. 7
Fig. 7. Comparative analysis for miR-1 targets in NSCLC smokers.
We compared gene expression levels between tumor and AT samples from 6 smokers and 3 non-smokers in our cohort. We selected the genes that were (A) expressed at a higher level in tumors (vs AT samples) and (B) in tumors from smokers vs non-smokers. (C) Had a known miR-1 binding site in their 3′UTR (based on three different prediction algorithms) and (D) were regulated by VEGF in ECs. E We compared the above genes with the list of the genes recruited by miR-1 to the RISC.
Fig. 8
Fig. 8. Validation of miR-1 targets in endothelial cells.
A HUVECs were transduced with v-miR-1 (or control vector). Ago-RIP was performed on cell lysates and the levels of each gene in the Ago pull immunoprecipitate/input lysate was measured and expressed as 2−∆∆Ct. (n = 4, *p < 0.03. B–E HPMEC were transfected with miR-1 mimic (miR-1) or control RNA (Ctrl) and exposed to 10% CSE for 24 h. mRNA/ reference gene levels were measured, normalized to Ctrl in PBS group, and expressed as 2−∆∆Ct. B NOTCH3 (n = 6, *p < 0.05), (C) HS3ST1 (n = 6, *p < 0.05), (D) SEMA4B (n = 6, *p < 0.025,**p = 0.0026 (E) TFAP4 (n = 6, p = NS). F, G HUVECs were transfected with NOTCH3 siRNA or scrambled control RNA (ctrl), exposed to 10% CSE for the indicated times. F Cell numbers were determined and normalized to values at time ‘0’ (n = 3 per group and time, *p < 0.03, **p < 0.02). G De novo DNA synthesis was determined using a BRDU ELISA colorimetric assay. Values were normalized to the baseline (time ‘0’) and presented as relative BRDU incorporation. (n = 8 per group and time, *p < 0.05, **p < 0.0002).
Fig. 9
Fig. 9. MiR-1 target genes in human lung and cancer field.
A–D Human lung tissues were cultured ex-vivo and exposed to 1% CSE. mRNA/ reference gene levels were measured, normalized to the mean value of the control group(0), and expressed as 2−∆∆Ct. A NOTCH3 (n > 10,*p = 0.02) (B) HS3ST1 (n > 10, *p = 0.013) (C) SEMA4B (n > 10, *p = 0.0071) (D) TFAP4 (n > 10, *p = 0.024). E–H mRNA/ reference gene levels were measured in the tumor (T), adjacent tissue, (AT), and distant tissue (DT) samples from 12 smokers and expressed as 2−∆Ct. Analysis was done by applying the one-way ANOVA nonparametric Friedman test. E NOTCH3 (n = 12, p = 0.0001), (F) HS3ST1 (n = 12, p = 0.0005). G SEMA4B (n = 12, p = 0.0003), (H) TFAP4 (n = 12, p = 0.04).

References

    1. Siegel, R. L., Miller, K. D. & Jemal, A. Cancer Statistics, 2017. CA Cancer J. Clin.67, 7–30 (2017). - PubMed
    1. Bray, F. et al. Global cancer statistics 2018: GLOBOCAN estimates of incidence and mortality worldwide for 36 cancers in 185 countries. CA Cancer J. Clin.68, 394–424 (2018). - PubMed
    1. Molina, J. R., Yang, P., Cassivi, S. D., Schild, S. E. & Adjei, A. A. Non-small cell lung cancer: epidemiology, risk factors, treatment, and survivorship. Mayo Clin. Proc.83, 584–594 (2008). - PMC - PubMed
    1. Herbst, R. S., Heymach, J. V. & Lippman, S. M. Lung Cancer. N. Engl. J. Med.359, 1367–1380 (2008). - PMC - PubMed
    1. Aberle, D. R. et al. Reduced lung-cancer mortality with low-dose computed tomographic screening. N. Engl. J. Med.365, 395–409 (2011). - PMC - PubMed

MeSH terms

LinkOut - more resources