. 2025 Mar 29;25(1):232.
doi: 10.1186/s12872-024-04397-7.

Cardioprotective role of SIRT1 activation on mitochondrial function in insulin-resistant H9c2 cells

Affiliations

Cardioprotective role of SIRT1 activation on mitochondrial function in insulin-resistant H9c2 cells

Buğrahan Sancak et al. BMC Cardiovasc Disord. .

Abstract

Background: Insulin-resistance in cardiomyocytes is often associated with metabolic disorders like obesity, and type2 diabetes. Studies demonstrated that sirtuin1 (SIRT1) plays a protective role in cells resistant to insulin by enhancing insulin sensitivity and improving glucose metabolism. Based on these protective functions observed in SIRT1, this study aims to investigate the roles of SIRT1 in palmitate (PA)-induced insulin-resistant H9C2 cells.

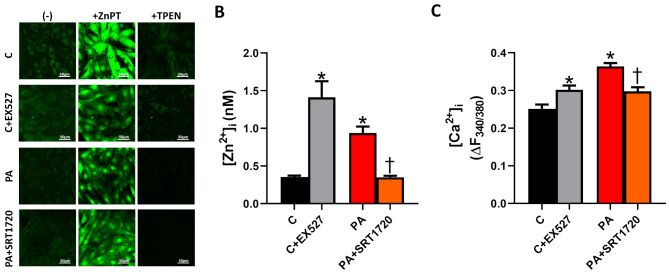
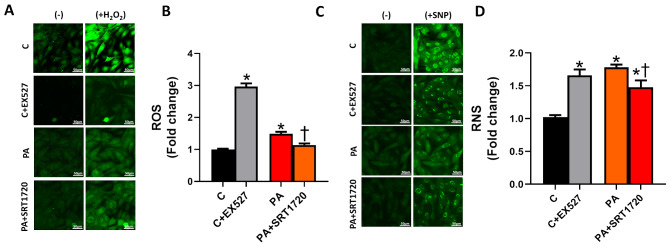
Methods: Insulin-resistance was induced in H9c2 cells via incubation with palmitic acid (50µM;24 h). Control and Insulin-resistant cells were incubated with SIRT1 inhibitor (EX527;10µM) and SIRT1 activator (SRT1720;2µM) for 24 h, respectively. Mitochondrial membrane potential (MMP), reactive oxygen/nitrogen species (ROS/RNS), total ATP production, intracellular free zinc and calcium levels ([Ca2+]i and [Zn2+]i) were monitored with fluorescence techniques. Protein levels were determined by using western-blot analysis.

Results: K-acetylation level was increased in PA-induced Insulin-resistant cells and SIRT1 inhibited control cells. ROS/RNS production, [Ca2+]i, and [Zn2+]i levels were elevated, MMP was depolarized and ATP production was decreased in PA and EX527 treated cells compared to control cells. Mfn1 and Fis1 levels were remained unchanged, however Mfn2 protein level was elevated in cells treated with PA and SIRT1 inhibitor. Nevertheless, anti- and pro-apoptotic protein level was reduced and augmented respectively in insulin-resistant and SIRT1 inhibited cells. Activation of SIRT1 in PA-treated cells restored mitochondrial function and intracellular ionic homeostasis, reduced K-acetylation, and mitigated apoptosis.

Conclusion: Therefore, it can be proposed that the activation of SIRT1, acting as a novel regulator, may offer direct cardioprotection by restoring mitochondrial function in the insulin-resistant heart.

Keywords: Calcium; Cardiomyocytes; Insulin-resistant; Mitochondria; SIRT1; Zinc.


Conflict of interest statement

Declarations. Ethics approval and consent to participate: Not applicable. Consent for publication: Not applicable. Competing interests: The authors declare no competing interests.

Figures

Fig. 1
Fig. 1
SIRT1 inhibition and palmitic acid (PA)-induced insulin-resistant H9c2 cells exhibited elevated lysine (K)-acetylation. (A) The representative original Western Blot image to determine the total K-acetylation level in control (C) cells incubated with and without SIRT1 inhibitor (EX527;10µM), PA-treated insulin-resistant cells incubated with and without SIRT1 activator (SRT1720;2µM) for 24 h. (B) The mean values of total K-acetylation protein levels are given as bar graphs after divided by total protein levels (Supplementary File). EX527 was used as an inhibitor, and SRT1720 as an activator of SIRT1. Bars are represented as mean (± SEM). N = 7–10. Significance level accepted at *p < 0.05 vs. C, and p < 0.05 vs. PA
Fig. 2
Fig. 2
The impact of SIRT1 inhibition and palmitic acid (PA)-induced insulin resistance on the levels of intracellular free zinc (([Zn2+]i) and calcium ([Ca2+]i). (A) Representative confocal images to determine the level of intracellular free Zn2+ ([Zn2+]i ). (B) The bar graph shows the calculated [Zn2+]i for the groups. The [Zn2+]i was measured with a Zn2+-selective fluorescence dye FluoZin-3AM. To determine the maximum and minimum fluorescence signals, the cells were treated with a zinc ionophore, Zn2+-pyrithione (+ ZnPT, 10µM), and a zinc-chelator, N,N, N′,N′-tetrakis(2-pyridinylmethyl)-1,2-ethanediamine (TPEN; 50µM), respectively. Ncells=50–80. (C) The bar graph represents the calculated intracellular free Ca2+ ([Ca2+]i) for the groups. The [Ca2+]i was measured with a ratiometric Ca2+-selective fluorescence dye Fura2-AM. Cells were excited at 340 and 380 nm, and emissions were collected at 525 ± 15 nm. Emissions derived from F340/380 were utilized as an estimate of the [Ca2+]i level. EX527 was used as an inhibitor, and SRT1720 as an activator of SIRT1. Bars are represented as mean (± SEM). The total number of cells used per group; ncells=10–12. Significance level accepted at *p < 0.05 vs. C, and p < 0.05 vs. PA
Fig. 3
Fig. 3
The role of SIRT1 inhibition and palmitic acid (PA)-induced insulin resistance on the levels of reactive oxygen and nitrogen species (ROS and RNS). ROS and RNS are measured in control (C) cells incubated with and without SIRT1 inhibitor (EX527;10µM), PA-treated insulin-resistant cells incubated with and without SIRT1 activator (SRT1720;2µM) for 24 h. (A) The confocal images representative of ROS measurements and (B) their mean values depicted as a bar graph (fold change). (C) The confocal images representative of RNS measurements and (D) their mean values depicted as a bar graph (fold change). EX527 was used as an inhibitor, and SRT1720 as an activator of SIRT1 Bars are represented as mean (± SEM). The total number of cells used per group; ncells=15–25. Significance level accepted at *p < 0.05 vs. C, and p < 0.05 vs. PA
Fig. 4
Fig. 4
The role of SIRT1 inhibition and palmitic acid (PA)-induced insulin resistance on the levels of mitochondrial membrane potential (MMP) and ATP production. MMP and ATP level are measured in control (C) cells incubated with and without SIRT1 inhibitor (EX527;10µM), PA-treated insulin-resistant cells incubated with and without SIRT1 activator (SRT1720;2µM) for 24 h. The representative ratio-metric original confocal traces (A) to determine the level of the mitochondrial membrane potential (MMP) in cells loaded with cell permeable JC-1 dye (5µM, 30 min) and (B) their mean values as bar graph. The dye was excited at 488 nm, and the emission was collected at both 535 nm (green signal; cytosolic accumulation of the dye) and 585 nm (red signal; mitochondrial accumulation of the dye). The mitochondria were depolarized, to calibrate the changes in MMP, with Carbonyl cyanide 4-trifluoromethoxy phenylhydrazone (FCCP; 5 µM). (C) Total ATP production was measured using a Luminescent based cell viability assay kit (Promega, G9241). EX527 was used as an inhibitor, and SRT1720 as an activator of SIRT1. The mean values represented as bar graph. Bars represent as mean (± SEM). The total number of cells used per group; ncell=90–70. Significance level accepted at *p < 0.05 vs. C, and p < 0.05 vs. PA
Fig. 5
Fig. 5
The role of SIRT1 inhibition and palmitic acid (PA)-induced insulin resistance on mitochondrial dynamics and apoptosis. (A) Representative Western blot images of Mfn1 (measured at 86 kDa), Mfn2 (measured at 86 kDa), and β-Actin (measured at 43 kDa). (B) Mean values of Mfn1, (C) Mfn2, (D) Mfn1/Mfn2 ratio are given as bar graph. (E) Representative Western blot images of Fis1, and β-Actin measured at 86 kDa and 43 kDa, respectively. (F) Mean value of Fis1 protein level is given as bar graph (G) The relative densitometric changes in the protein ratio of Bax (measured at 21 kDa) to Bcl-2 (measured at 26 kDa) and (H) mean values in the groups of cells are given as bar graph. EX527 was used as an inhibitor, and SRT1720 as an activator of SIRT1. Bars represent as mean (± SEM). N = 5–10. Significance level accepted at *p < 0.05 vs. C, and p < 0.05 vs. PA
Fig. 6
Fig. 6
Cellular alterations in palmitic acid (PA)-induced insulin resistance model in H9c2 cells. Insulin-resistance markedly increased the acetylation of lysine residues in peptide chains (Hyper K-Acetylation). Hyper K-Acetylation caused mitochondrial dysfunction which was reflected in mitochondrial fragmentation, lowered ATP production, and mitochondrial membrane (ΔΨm) depolarization. Parallelly K-acetylation increased cellular oxidative stress which affected the levels of ROS and RNS. Cellular ionic homeostasis was impaired. Intracellular free zinc ([Zn2+]i) and free calcium ([Ca2+]i) concentrations were increased. All these alterations caused increased apoptosis and impaired contractile function both of which are hallmarks of cardiac dysfunction. SIRT1 is one of the major regulators of intracellular K-acetylation levels. EX527 was used as an inhibitor, and SRT1720 as an activator of SIRT1

References

    1. Lebovitz HE. Insulin resistance: definition and consequences. Exp Clin Endocrinol Diabetes. 2001;109(Suppl 2):S135–148. - PubMed
    1. Huang PL. A comprehensive definition for metabolic syndrome. Dis Model Mech. 2009;2(5–6):231–7. - PMC - PubMed
    1. Yudhani RD, Sari Y, Nugrahaningsih DAA, Sholikhah EN, Rochmanti M, Purba AKR, Khotimah H, Nugrahenny D, Mustofa M. In Vitro Insulin Resistance Model: A Recent Update. J Obes 2023, 2023:1964732. - PMC - PubMed
    1. Wang YC, Peterson SE, Loring JF. Protein post-translational modifications and regulation of pluripotency in human stem cells. Cell Res. 2014;24(2):143–60. - PMC - PubMed
    1. Schaffert LN, Carter WG. Do post-translational modifications influence protein aggregation in neurodegenerative diseases: a systematic review. Brain Sci 2020, 10(4). - PMC - PubMed

MeSH terms

LinkOut - more resources