. 2025 Mar 28;26(1):306.
doi: 10.1186/s12864-025-11442-y.

Copy number normalization distinguishes differential signals driven by copy number differences in ATAC-seq and ChIP-seq

Affiliations

Copy number normalization distinguishes differential signals driven by copy number differences in ATAC-seq and ChIP-seq

Dingwen Su et al. BMC Genomics. .

Abstract

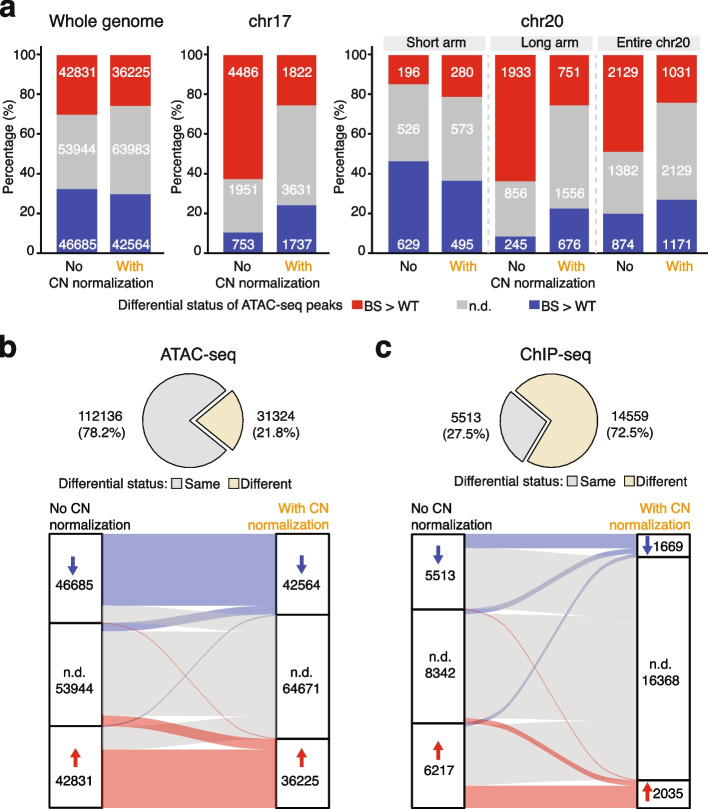
A common objective across ATAC-seq and ChIP-seq analyses is to identify differential signals across contrasted conditions. However, in differential analyses, the impact of copy number variation is often overlooked. Here, we demonstrated copy number differences among samples could drive, if not dominate, differential signals. To address this, we propose a pipeline featuring copy number normalization. By comparing the averaged signal per gene copy, it effectively segregates differential signals driven by copy number from other factors. Further applying it to Down syndrome unveiled distinct dosage-dependent and -independent changes on chromosome 21. Thus, we recommend copy number normalization as a general approach.

Keywords: ATAC-seq; Aneuploidy; ChIP-seq; Copy number normalization; Copy number variation; Differential analysis; Dosage effects; Down syndrome.


Conflict of interest statement

Declarations. Ethics approval and consent to participate: Not applicable. Competing interests: The authors declare no competing interests.

Figures

Fig. 1
Fig. 1
Copy number variation drives the differential signals in ATAC-seq data. a Genome-wide copy number ratio (CNR) in the BS sample relative to the WT sample. Orange dots indicate the CNR for each 50 kb bin and blue lines indicate DNA segments with the same CNR. b MA plot comparing the chromatin accessibility in BS vs. WT samples by DESeq2. FC, fold change. c The trended biases of differential chromatin accessibility from copy number differences without (left) and with (right) copy number (CN) normalization in ATAC-seq data. Log2CNR > 0 and log2CNR < 0 imply relative number gain and loss in BS, respectively. The lines represent the locally weighted running line smoother (LOESS) smoothing curve for the data with the grey area indicating the 95% confidence interval for the fitted curve. d CNR and the distribution of differential peaks without and with CN normalization on chro- mosome 17 (chr17). Peaks with adjusted P (p-adj) < 0.05 are depicted in blue or red while those with p-adj ≥ 0.05 are shown in grey. e CNR and the distribution of differential peaks without and with CN normalization on chr20. Peaks with p-adj < 0.05 are depicted in blue or red while those with p-adj ≥ 0.05 are shown in grey
Fig. 2
Fig. 2
A copy-number-aware differential analysis pipeline featuring copy number normalization
Fig. 3
Fig. 3
Impacts of copy number normalization on differential analysis. a Number of significantly and not significantly differential ATAC-seq peaks across the genome (left), on chromosome 17 (chr17, middle) and on chr20 (right) before and after applying copy number (CN) normalization. N.d. indicates not significantly differential signals with adjusted P (p-adj) ≥ 0.05. b Differential status of open chromatin regions before and after applying CN normalization. N.d. indicates not significantly differential signals with p-adj ≥ 0.05. c Differential status of G-quadruplex forming sites before and after applying CN normalization in ChIP-seq data. N.d. indicates not significantly differential signals with FDR ≥ 0.05
Fig. 4
Fig. 4
Copy number normalization identifies regions with dosage and compensatory effects in Down syndrome. a Average ATAC-seq signal profiles (top) and chromatin accessibility (bottom) of peaks on chromosome 21 (chr21) in wildtype (WT) and Down syndrome (DS) samples. b Average ATAC-seq signal profiles of peaks on chr17 in WT and DS samples. c Distribution of differential signals regarding total chromatin accessibility (top) and average chromatin accessibility per chr21 (bottom) in ATAC-seq peaks. d Categories of open chromatin regions on chr21 defined according to changes in total chromatin accessibility and average chromatin accessibility per chr21. N.d. indicates not significantly differential signals with adjusted P (p-adj) < 0.05; arrows denote significantly increased or decreased signals with p-adj < 0.05. e Open chromatin regions in UBASH3A and APP genes exhibiting compensatory effects (shaded in blue), dosage effects (shaded in dark orange) or both dosage effects and CN-independent increases (shaded in light orange). Peaks without shading displayed no change in either total or average chromatin accessibility per chr21. Arrows on the gene models indicate the transcription direction
Fig. 5
Fig. 5
Copy number correction using alternative copy number detection tools and HMCan-diff. a Comparison of significantly differential ATAC-seq peaks in BS vs. WT ATAC-seq data, detected either by HMCan-diff (using the program’s default filter) or by our pipeline (adjusted P-value (p-adj) < 0.05). Trends in differential chromatin accessibility biases caused by copy number differences, shown without (left) and with (right) copy number (CN) normalization. CN ratios (CNRs) were identified using QDNAseq (b), CopywriteR (c), and Codex2 (d). Log2CNR > 0 and log2CNR < 0 indicate relative copy number gain and loss in BS, respectively. Yellow lines represent the generalized additive model (GAM) fitted to the data, with the grey shaded area indicating the 95% confidence interval for the fitted curve. e The number and proportion of differential ATAC-seq peaks across the genome, on chr17, and on chr20, before and after applying CN normalization based on our pipeline but with alternative CNV detection tools or with HMCan-diff. N.d. not significantly differential signals (p-adj ≥ 0.05)

Similar articles

References

    1. Buenrostro JD, Giresi PG, Zaba LC, Chang HY, Greenleaf WJ. Transposition of native chromatin for fast and sensitive epigenomic profiling of open chromatin, DNA-binding proteins and nucleosome position. Nat Methods. 2013;10:1213–8. - PMC - PubMed
    1. Klemm SL, Shipony Z, Greenleaf WJ. Chromatin accessibility and the regulatory epigenome. Nat Rev Genet. 2019;20:207–20. - PubMed
    1. Ma S, Zhang Y. Profiling chromatin regulatory landscape: insights into the development of ChIP-seq and ATAC-seq. Mol Biomed. 2020;1:9. - PMC - PubMed
    1. Furey TS. ChIP–seq and beyond: new and improved methodologies to detect and characterize protein–DNA interactions. Nat Rev Genet. 2012;13:840–52. - PMC - PubMed
    1. Park PJ. ChIP–seq: advantages and challenges of a maturing technology. Nat Rev Genet. 2009;10:669–80. - PMC - PubMed

MeSH terms

LinkOut - more resources