. 2025 Mar 28;25(1):559.
doi: 10.1186/s12885-025-13923-5.

Identification and validation of molecular subtypes and prognostic models in patients with kidney cancer based on differential genes based on B cells: a multiomics analysis

Affiliations

Identification and validation of molecular subtypes and prognostic models in patients with kidney cancer based on differential genes based on B cells: a multiomics analysis

Jiaao Sun et al. BMC Cancer. .

Abstract

Background: B cells play a variety of complex roles in cancer, both promoting cancer progression and enhancing anti-tumor immune responses, but their mechanism of action in kidney cancer has not been elucidated.

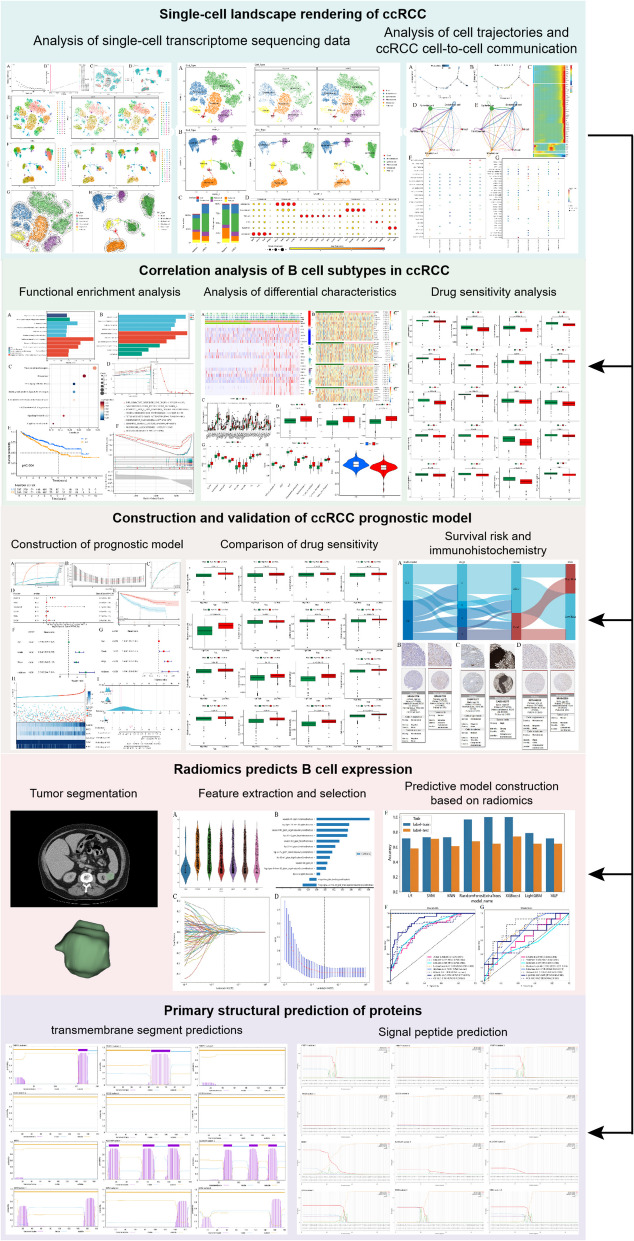
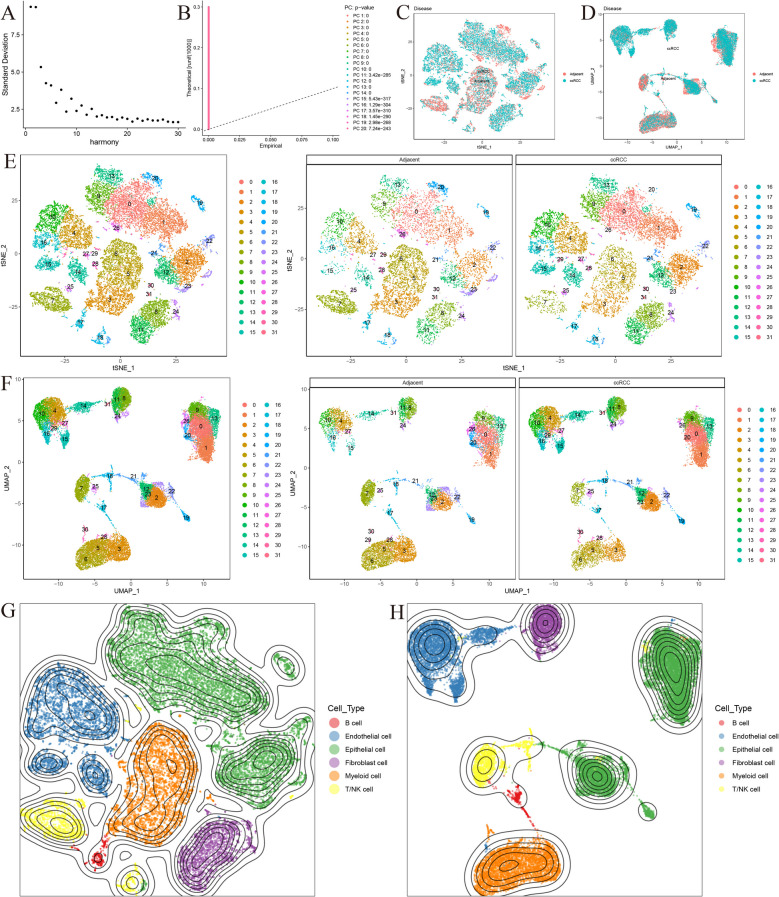
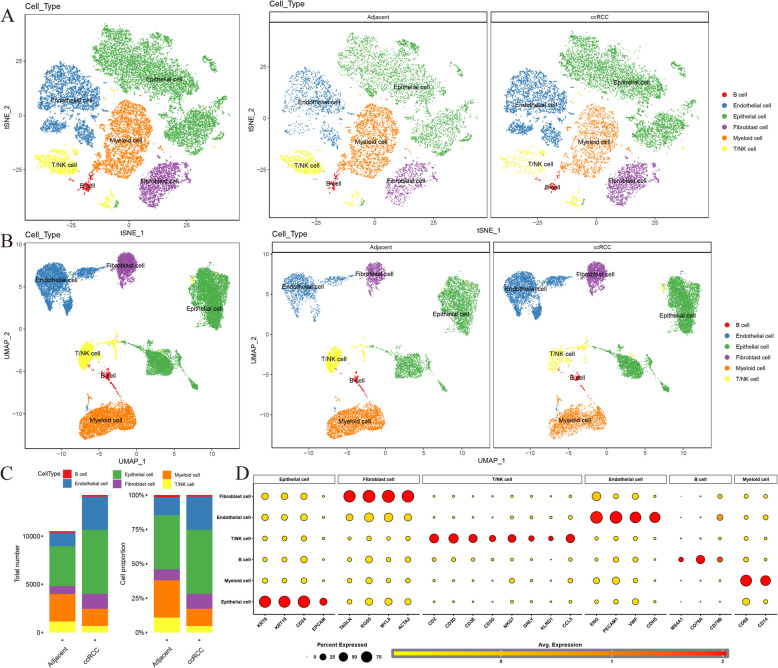
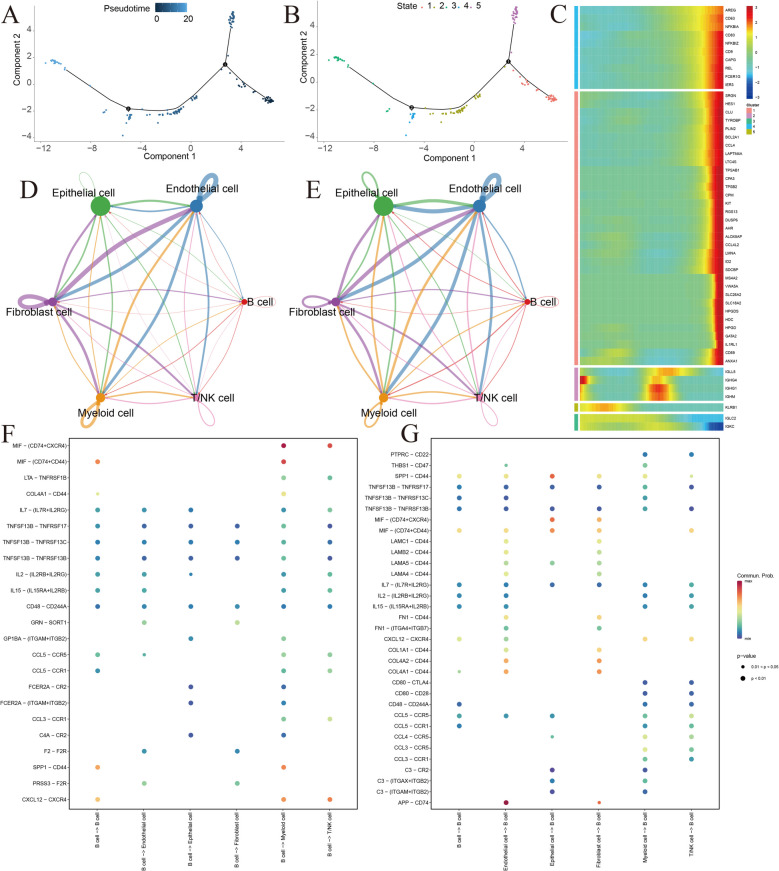
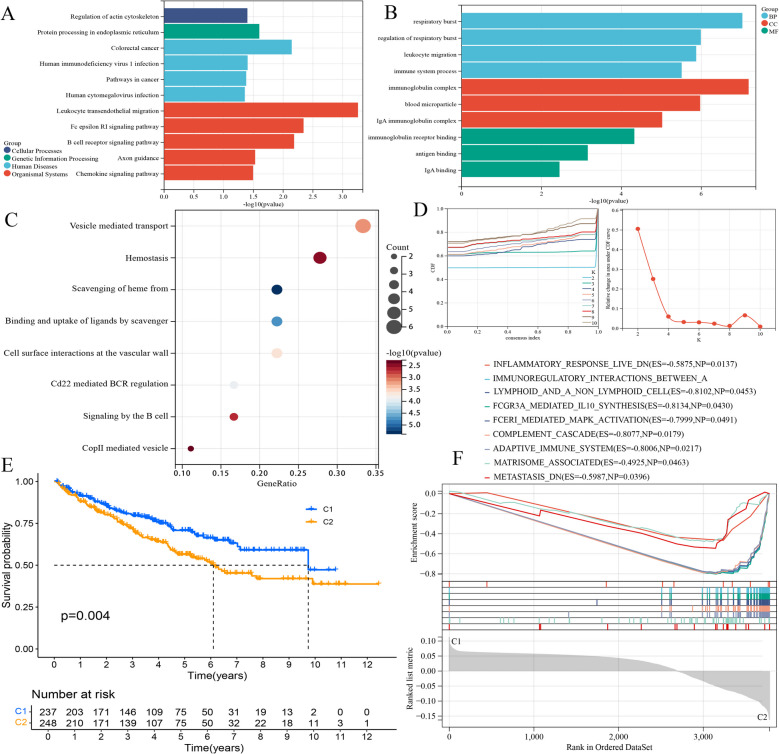
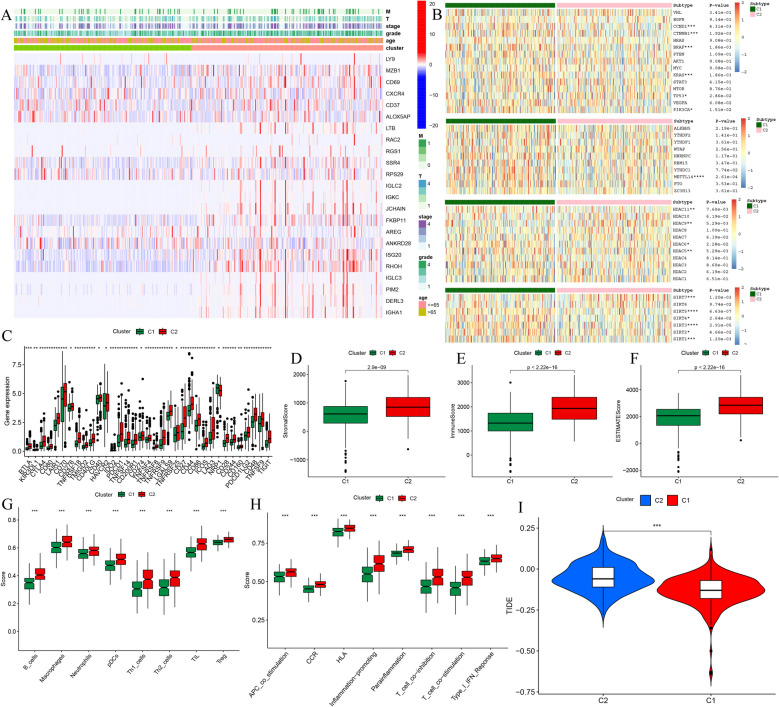
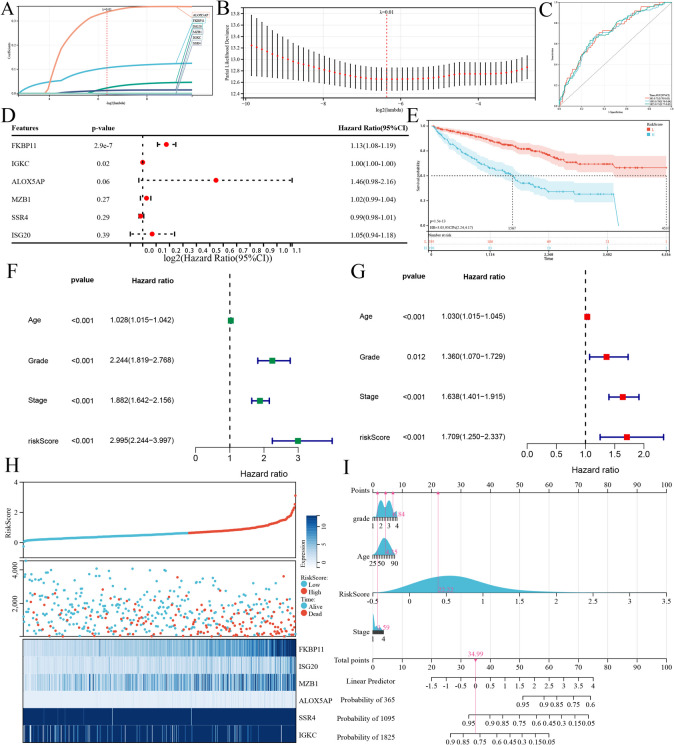
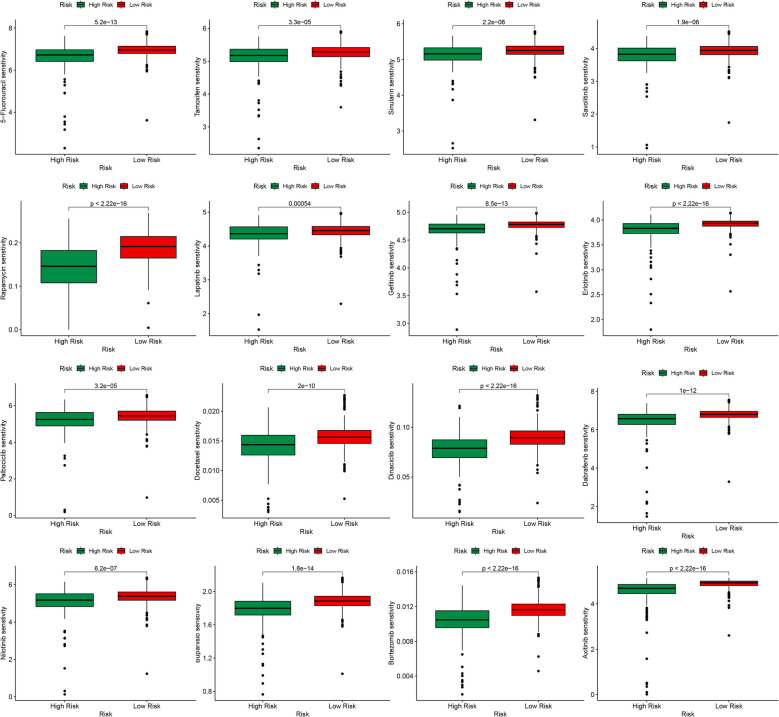
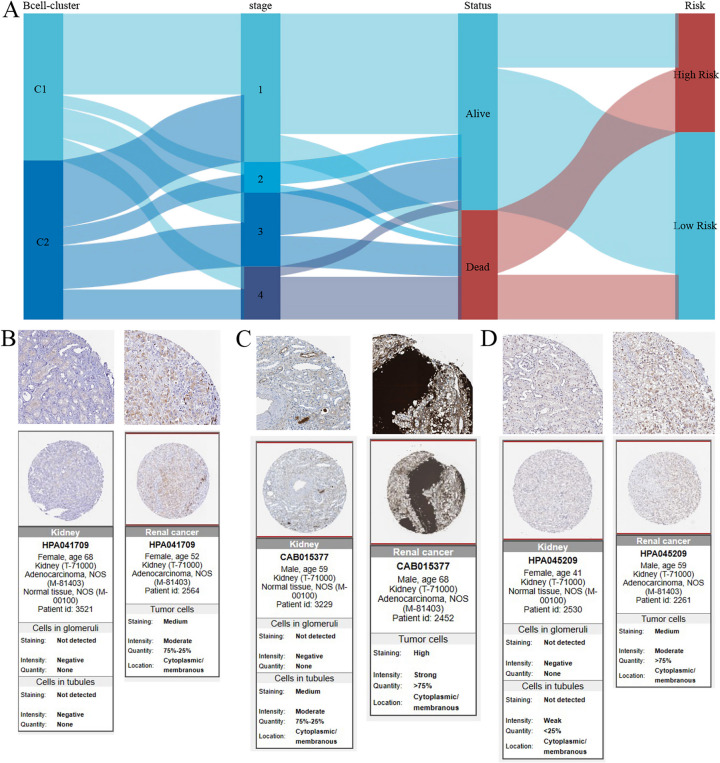
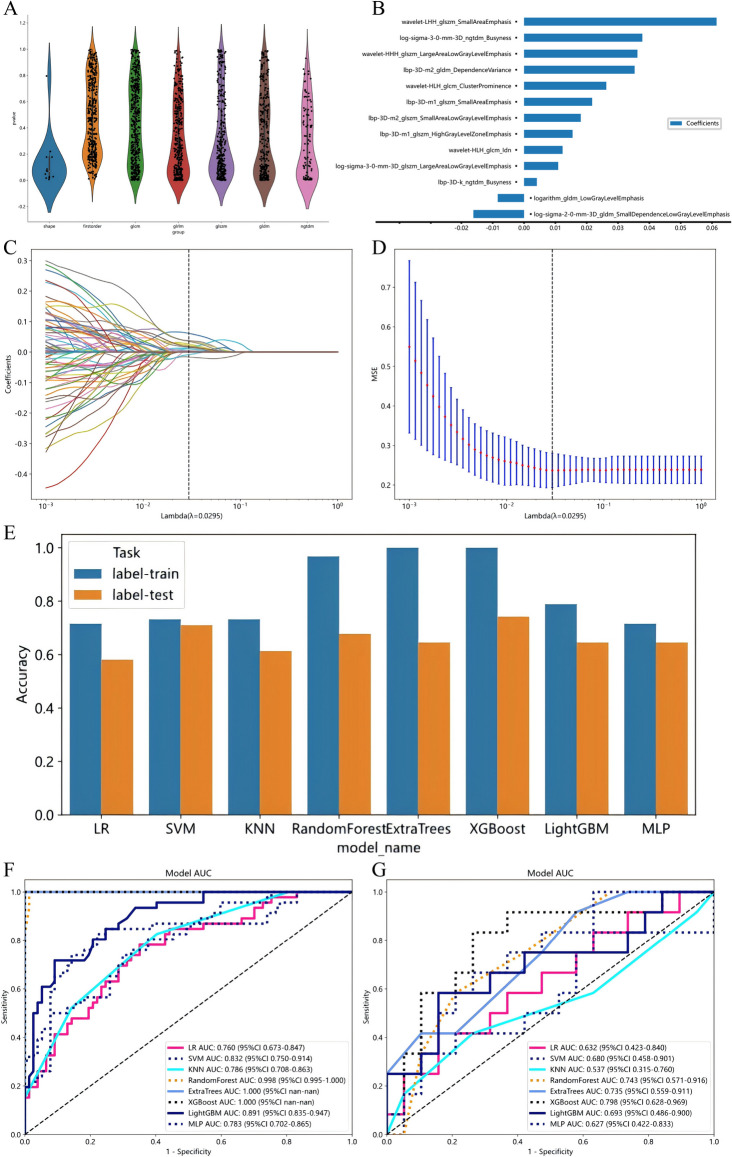
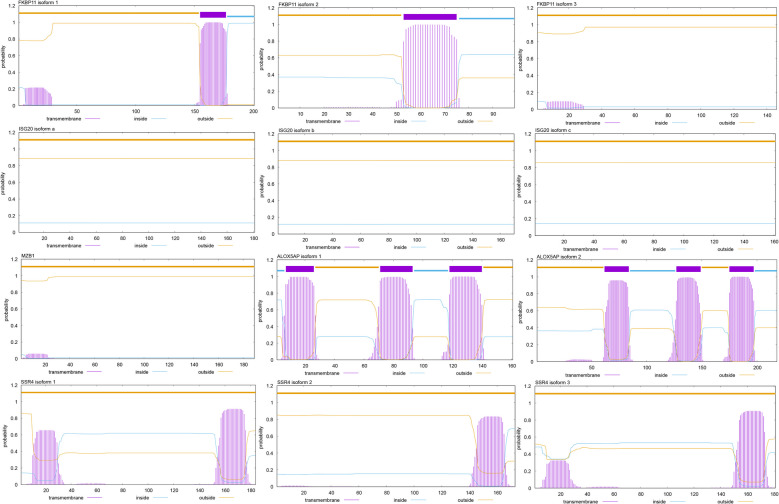
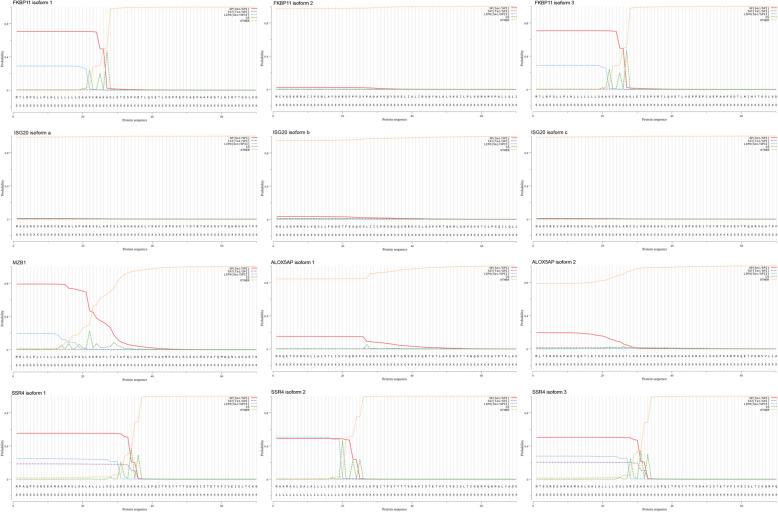
Results: We collected kidney cancer sample data from the GEO database and TCGA database, mapped the single-cell landscape inside kidney cancer tissue, identified 25 B-cell-related genes, and based on this, identified related molecular subtypes of kidney cancer patients, and explored their internal microenvironment characteristics. Finally, we constructed a 6-gene biological prognostic model that can be used to predict survival in patients with renal cancer, and we further validated the predictive performance of the model based on imaging omics. It is worth mentioning that the structural patterns and functional sites of 6 model gene transcription proteins were also mined.

Conclusions: Overall, we explored for the first time the profound role of B cells in kidney cancer and developed a bio-predictive model based on B cell-related genes, providing scientific guidance for personalized treatment of kidney cancer patients.

Keywords: B cell; Immune microenvironment; Multiomics; Prognostic model; Renal carcinoma.


Conflict of interest statement

Declarations. Ethics approval and consent to participate: Not applicable. Consent for publication: Not applicable. Competing interests: The authors declare no competing interests.

Figures

Fig. 1
Fig. 1
Study flow chart
Fig. 2
Fig. 2
A Elbow plot showing optimal cluster number. B JackStraw analysis was used to select significant principal components. C 24,793 high-quality cell t-SNE maps after QC were used to reflect the dimensionality reduction between RCC and normal tissue samples. D 24,793 high-quality cell UMAP after QC were used to reflect the dimensionality reduction between RCC and normal tissue samples. E t-SNE color-coded visualization of RCC with cluster cells of normal tissue samples with a total of 32 cell clusters at a resolution of 1.5. F UMAP color-coded visualization of RCC and normal tissue samples of clustered cells with a total of 32 cell clusters at a resolution of 1.5. G Six major cell types identified by the t-SNE map. H Six main cell types identified by UMAP
Fig. 3
Fig. 3
A t-SNE illustrates the results of annotating cell subpopulations in RCC versus normal tissue. B UMAP illustrates the results of annotating cell subpopulations in RCC versus normal tissues. C The bar chart visually shows the ratio of the number of 6 types of cells in RCC and para-cancerous tissue. D Marker genes for the six cell types identified
Fig. 4
Fig. 4
A Trajectory analysis results of the B cell. Different shades of blue represent different times. B Five developmental states divided the developmental trajectories of B cells. C Heat maps of differentially expressed genes in each branch of RCC with pseudo time and hierarchical clustering. D The number of cell communications between the six-cell components in the RCC tumor microenvironment. E The strength of cell communication between the six-cell components in the RCC tumor microenvironment. F The bubble map shows the intensity with which B cells regulate other cell types through ligand-receptor interactions. G The bubble map demonstrates the intensity of regulation of B cells by other cell types through ligand-receptor interactions
Fig. 5
Fig. 5
A KEGG enrichment analysis of B cell related gene sets. B GO enrichment analysis of B cell related gene set. C Reactome enrichment analysis of B cell related gene set. D Cluster analysis results show that the optimal cluster number k = 2 is determined by the cumulative experience distribution function graph. E Comparison of survival of C1 and C2 subtypes. F Pathway enrichment of C1 and C2 subtypes was analyzed by GSEA
Fig. 6
Fig. 6
A Heat maps showing clinical data for C1 and C2 subtypes and B-cell-associated gene expression levels. B Expression differences of deacetylation-related genes (HDAC and SITR), RNA methylation-related genes (ALKBH5, WTAP, FTO, etc.), and proto-oncogenes (VHL, TP53, MTOR, etc.) between C1 and C2 subtypes. C Expression comparison of immune checkpoint-related genes of C1 and C2 subtypes. The ESTIMATE analysis showed stromal scores (D), immune scores (E), and tumor purity scores (F) for C1 and C2 subtypes. G Comparison of the degree of immune cell infiltration between C1 and C2 subtypes. H Comparison of immune activity between C1 and C2 subtypes. I Comparison of immune escape levels between C1 and C2 subtypes
Fig. 7
Fig. 7
Comparison of the sensitivity of C1 and C2 subtypes to 20 RCC-targeting drugs
Fig. 8
Fig. 8
A, B Regression analysis was performed by the lasso-cox method to obtain the optimal model, and the gene model composed of six genes (FKBP11, ISG20, MZB1, ALOX5AP, SSR4, and IGKC) was obtained. C ROC curves for RCC patients at 1, 3, and 5 years. D Forest maps showing the statistical significance and Hazard Ratio of each model gene. E Comparison of survival in high—and low-risk groups. F Univariate independent prognostic analysis. G Multivariate independent prognostic analysis. H Heat maps showed changes in survival and model gene expression levels of RCC patients as Riskscore increased. I We draw a nomogram to accurately predict the survival probability of RCC patients for 1, 3, and 5 years
Fig. 9
Fig. 9
Comparison of the sensitivity of patients in high and low-risk groups to 16 RCC-targeting drugs
Fig. 10
Fig. 10
A Mulberry diagram shows the polymerization relationship of B cell molecular subtypes, stage, survival state, and risk subtypes. Immunohistochemical results of FKBP11 (B), IGKC (C), and SSR4 (D) in RCC and paracancer tissues
Fig. 11
Fig. 11
A Feature distribution after feature extraction by pyradiomicv3.0 toolkit on the collected ROI, totaling 1830 features. B Use the LASSO method to select the weight of each feature with 13 high weights. C, D 13 high-weight features were selected by the LASSO method to construct our model. E Histogram of the accuracy of predicted results of 8 models in the training set and test set. F ROC curves of 8 models predicting the high and low groups of B-cell-related gene expression in the training set. G Eight models predicted ROC curves of high and low groups of B-cell-related gene expression in the test set
Fig. 12
Fig. 12
shows transmembrane segment predictions for all subtypes of FKBP11, ISG20, MZB1, ALOX5AP, and SSR4 proteins
Fig. 13
Fig. 13
shows the prediction of signal peptides for all subtypes of FKBP11, ISG20, MZB1, ALOX5AP, and SSR4 proteins

Similar articles

References

    1. Jonasch E, Walker CL, Rathmell WK. Clear cell renal cell carcinoma ontogeny and mechanisms of lethality. Nat Rev Nephrol. 2021;17(4):245–61. - PMC - PubMed
    1. González-Garza R, et al. Biomarkers for evaluating the clinical response to immune checkpoint inhibitors in renal cell carcinoma (Review). Oncol Rep. 2024;52(6):1–0. - PubMed
    1. Kase AM, George DJ, Ramalingam S. Clear Cell Renal Cell Carcinoma: From Biology to Treatment. Cancers (Basel). 2023;15(3):665. - PMC - PubMed
    1. Chakiryan NH, et al. Real-world survival outcomes associated with first-line immunotherapy, targeted therapy, and combination therapy for metastatic clear cell renal cell carcinoma. JAMA Netw Open. 2021;4(5): e2111329. - PMC - PubMed
    1. Chipuc S, et al. Immunotherapeutic innovations in clear cell renal cell carcinoma: current strategies and future directions. Cancer Diagn Progn. 2024;4(5):558–62. - PMC - PubMed

Substances

LinkOut - more resources