. 2025 Mar 29;20(1):42.
doi: 10.1186/s13020-025-01091-4.

Integrative network pharmacology, transcriptomics, and proteomics reveal the material basis and mechanism of the Shen Qing Weichang Formula against gastric cancer

Affiliations

Integrative network pharmacology, transcriptomics, and proteomics reveal the material basis and mechanism of the Shen Qing Weichang Formula against gastric cancer

Yi Wang et al. Chin Med. .

Abstract

Background: Gastric cancer (GC) is a common malignancy with poor prognosis and lack of efficient therapeutic methods. Shen Qing Weichang Formula (SQWCF) is a patented traditional herbal prescription for GC, but its efficacy and underlying mechanism remains to be clarified.

Purpose: To explore the efficacy and potential mechanism of SQWCF in treating GC.

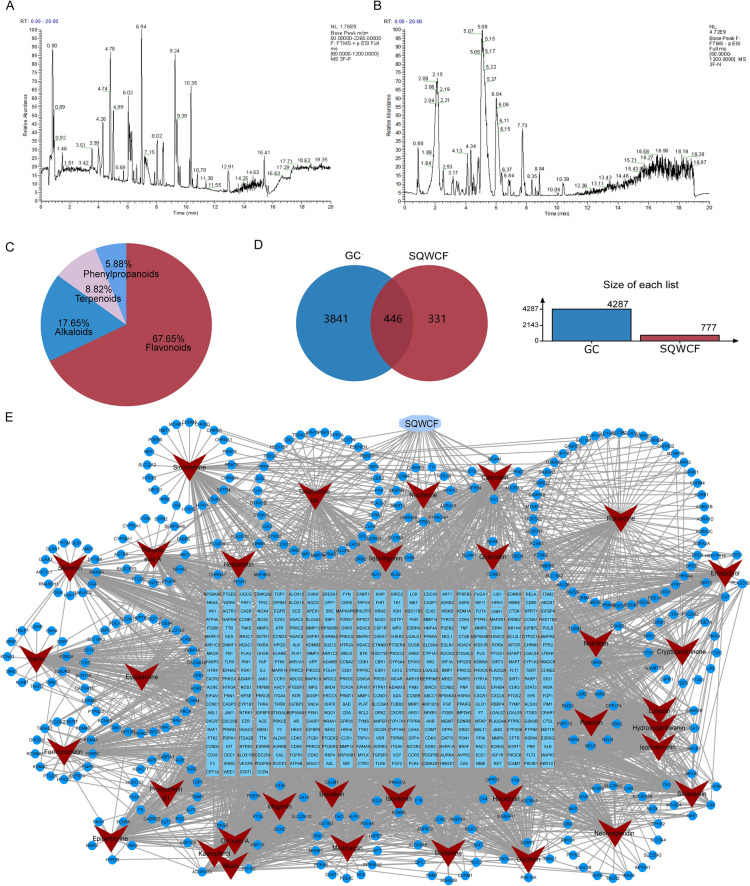
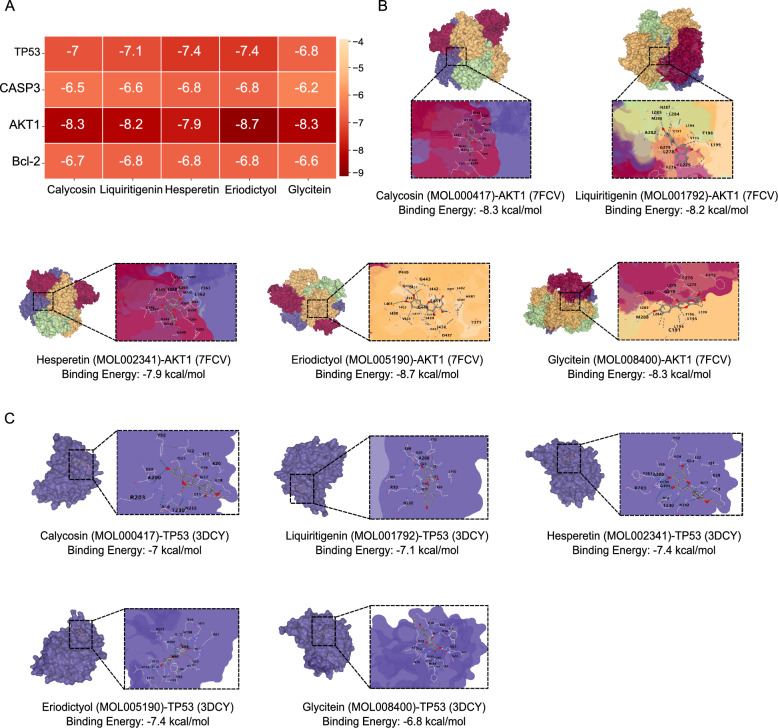
Methods: A subcutaneous transplantation tumor model of human GC was established for assessing SQWCF's efficacy and safety. A comprehensive strategy integrating mass spectrometry, network pharmacology, omics analysis, and bioinformatic methods was adopted to explore the core components, key targets, and potential mechanism of SQWCF in treating GC. Molecular docking, immunohistochemistry, quantitative real-time PCR, and western blot were applied to validation.

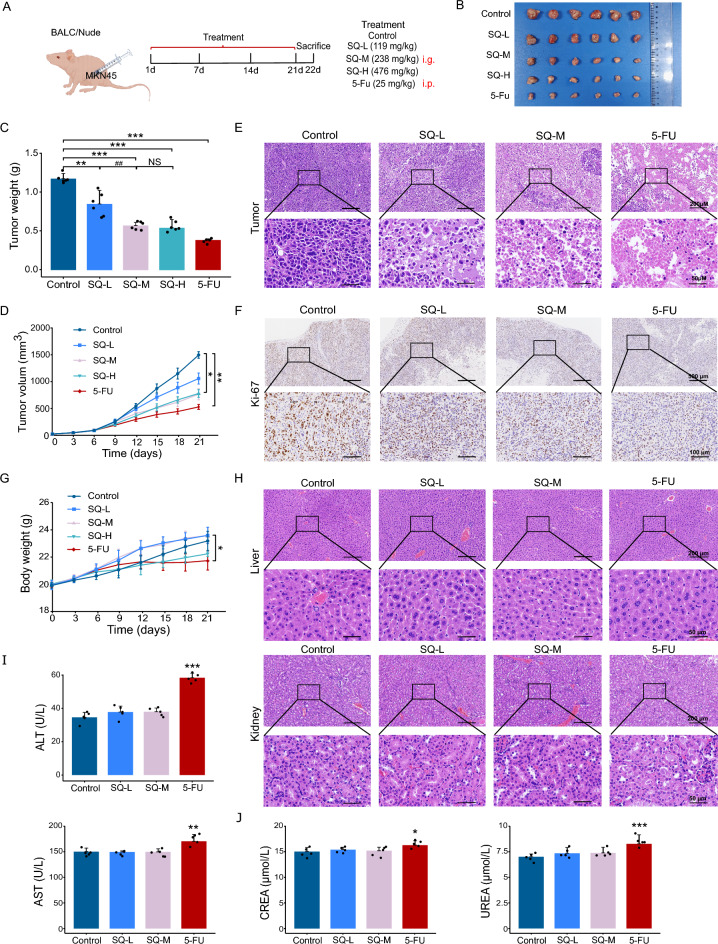
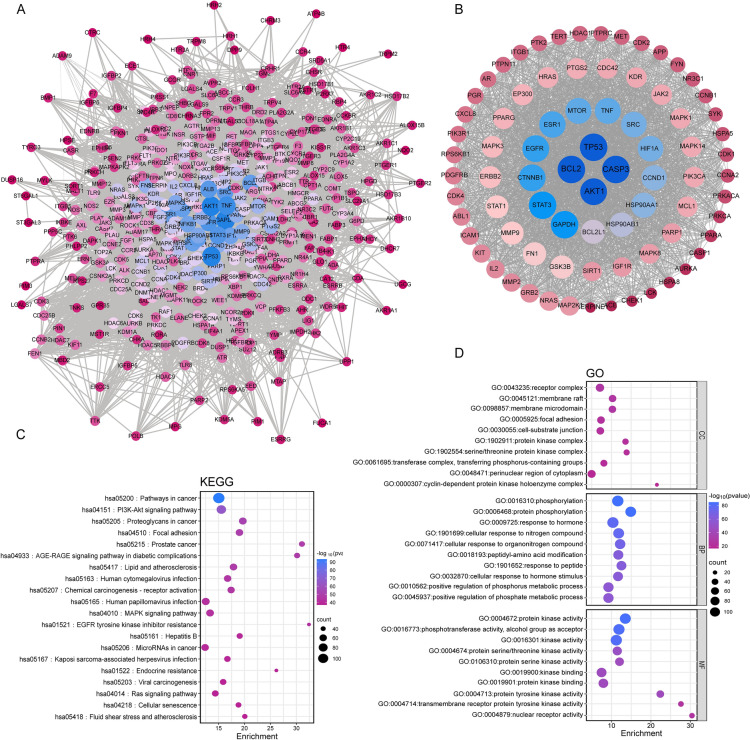
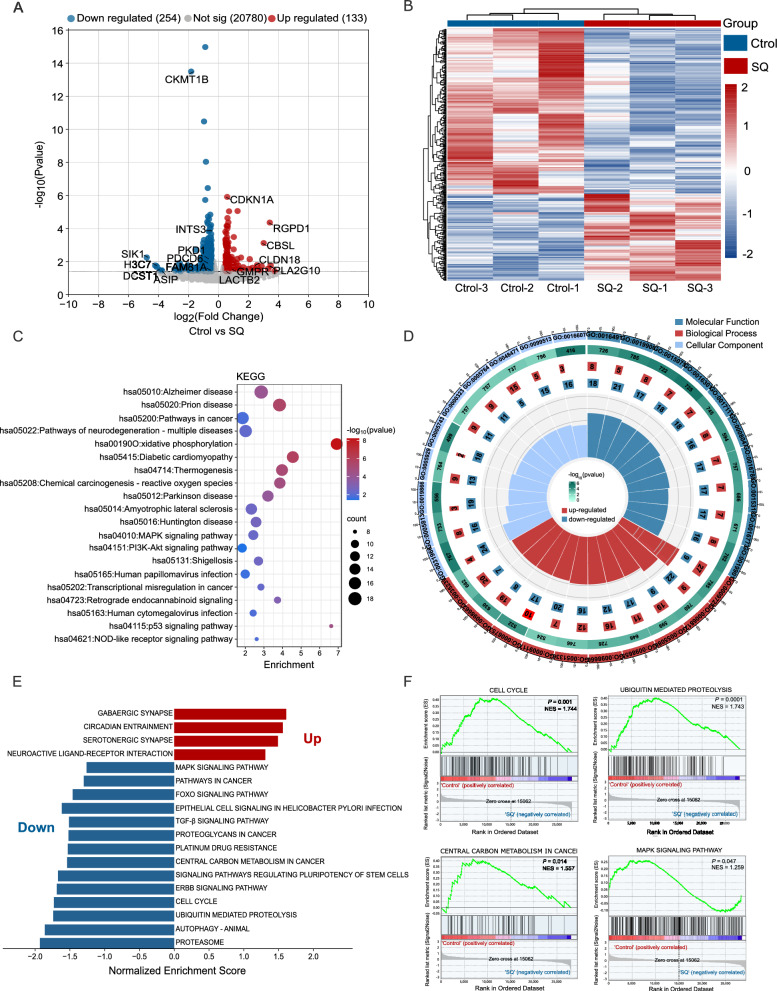
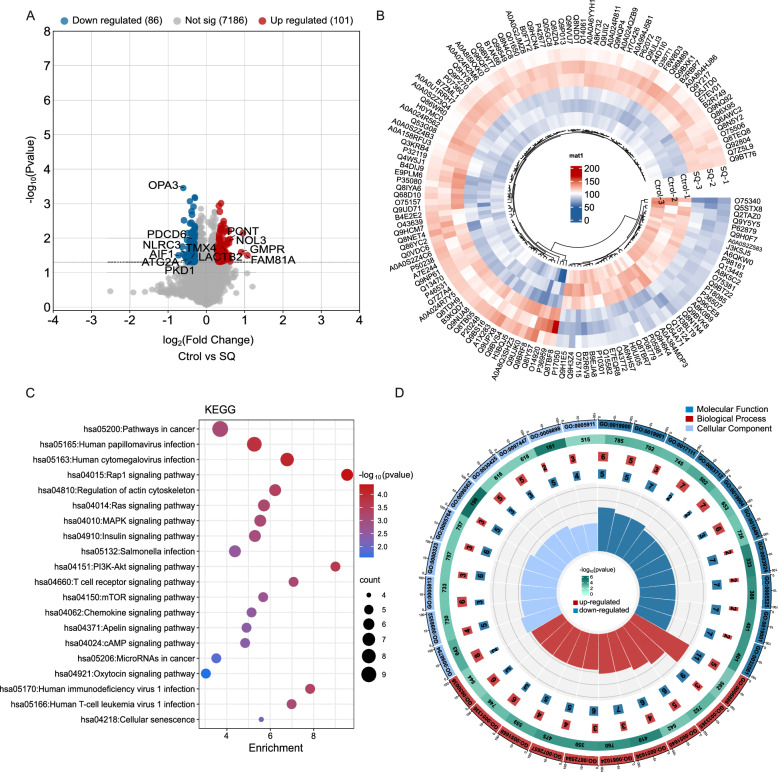
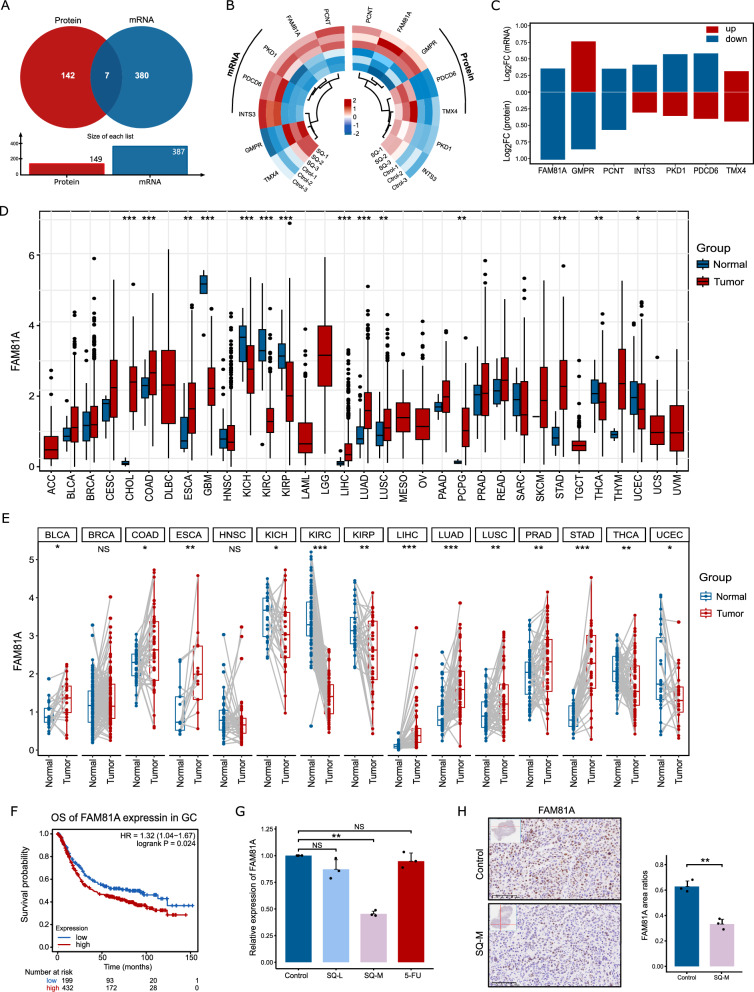
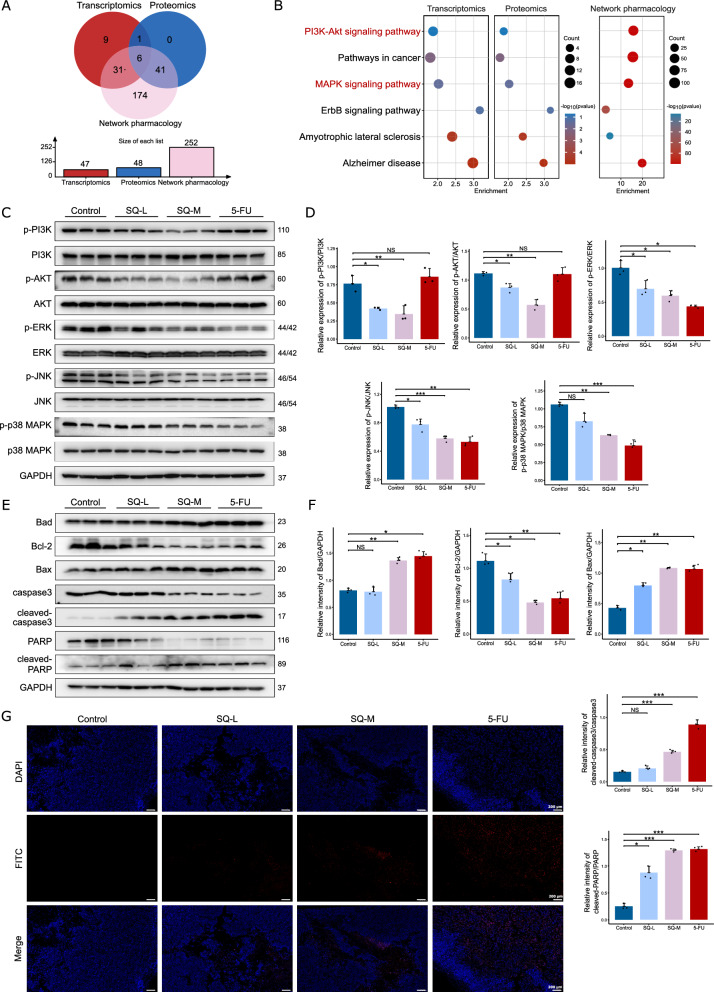
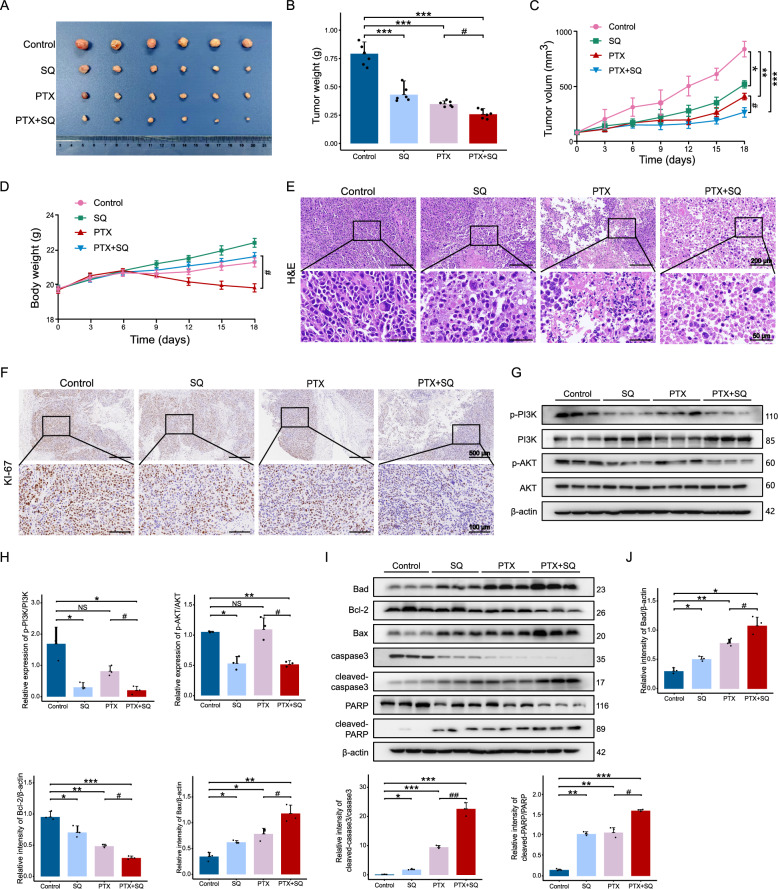
Results: In the mouse model of GC, SQWCF effectively suppressed the GC growth without evident toxicity and enhanced the therapeutic efficacy of paclitaxel. Network pharmacology and molecular docking based on mass spectrometry showed that key targets (CASP3, TP53, Bcl-2, and AKT1) and core active components (Calycosin, Glycitein, Liquiritigenin, Hesperetin, and Eriodictyol) involved in the anti-GC effect of SQWCF had stable binding affinity, of which AKT1 ranked the top in the affinity. Validation based on network pharmacology and omics analysis confirmed that PI3K-AKT and MAPK signaling pathways, as well as downstream apoptosis pathway, explained the therapeutic effects of SQWCF on GC. In addition, family with sequence similarity 81 member A (FAM81A) was identified as a novel biomarker of GC that was aberrantly highly expressed in GC and associated with poor prognosis by bioinformatic analysis, and was an effector target of SQWCF at both mRNA and protein levels.

Conclusion: This study uncovers a synergistic multi-component, multi-target, and multi-pathway regulatory mechanism of SQWCF in treating GC comprehensively, emphasizing its potential for therapeutic use and providing new insights into GC treatment.

Keywords: Apoptosis; Gastric cancer; MAPK signaling pathway; Network pharmacology; PI3K-AKT signaling pathway; Paclitaxel; Proteomics; Shen Qing Weichang formula; Transcriptomics.


Conflict of interest statement

Declarations. Conflict of interest: The authors declare that they have no known competing financial interests or personal relationships that could have appeared to influence the work reported in this paper. Ethics approval and consent to participate: The animal study protocol was approved by the Experimental Animal Ethics Committee of Shanghai University of Traditional Chinese Medicine (Approval Document: PZSHUTCM2304100001). Consent for publication: Not applicable.

Figures

Fig. 1
Fig. 1
SQWCF suppressed the growth of GC in vivo. A Experience design. B The physical appearance and size of the tumor tissues. C The tumor weight statistics. D The tumor volume statistics. E H&E staining of the tumor tissues. F IHC staining of Ki-67 in tumor tissues. G The body weight statistics. F HE staining of liver and kidney tissues. I–J Levels of liver and renal function indicators in serum. Data were presented as mean ± SD. Compared to control: *p < 0.05, **p < 0.01, ***p < 0.001. Compared to SQ-M: ##p < 0.01, NS, no significant
Fig. 2
Fig. 2
The SQWCF-target network analysis based on identification of chemical components. A The chromatogram of SQWCF in positive mode. B The chromatogram of SQWCF in negative mode. C Classification and quantity of chemical components with OB value ≥ 30% and DL value ≥ 0.18. D Intersections of SQWCF and GC targets. E The compounds-targets network of SQWCF against GC. Red represents chemical compounds of SQWCF, and blue represents their related targets. The shallow blue represents SQWCF-GC common targets, the dark blue represents unique targets. Edges between nodes represent target-target associations in the network
Fig. 3
Fig. 3
The identification of SQWCF’s key targets and KEGG and GO enrichment analysis. A Interaction network of common gene targets. B Visualization network of key targets. The color intensity and the diameter of each circle reflects the degree of criticality of each gene target, with darker colors and larger circular areas indicating greater criticality. Edges between nodes represent target-target associations in the network. C–D KEGG and GO enrichment analysis of SQWCF-GC common target genes
Fig. 4
Fig. 4
Molecular docking results. A Heatmap of molecular docking scores. BC The docking of the two targets with the best docking activities (AKT1 and TP53) and compounds (Calycosin, Glycitein, Liquiritigenin, Hesperetin, and Eriodictyol). All pictures show the 3D docking of ligands in the active binding pocket (left or up), with the hydrophobic effect area and the 2D interaction patterns between the ligands and proteins (right or down)
Fig. 5
Fig. 5
Transcriptomics analysis for the mechanisms of SQWCF against GC. A Volcano plot of DEGs between control and SQWCF group. B Heatmap of the different abundance genes among control and SQWCF group. C–D KEGG and GO enrichment analysis of DEGs. E–F GSEA analysis of DEGs. NES, normalized enrichment score
Fig. 6
Fig. 6
Proteomics analysis for the mechanisms of SQWCF against GC. A Volcano plot of DEPs between control and SQWCF group. B Heatmap of the different abundance proteins among control and SQWCF group. C–D KEGG and GO enrichment analysis of DEPs
Fig. 7
Fig. 7
Analysis of transcriptomics combined with proteomics. A The common targets of DEGs and DEPs. B Heatmap visualizing targets that are differentially expressed in transcriptomics and proteomics analysis. C The fold change of the common differentially expressed targets in transcriptomics and proteomics analysis. D FAM81A expression in TCGA tumors and normal tissues with the data of the GTEx database as controls. E FAM81A expression in TCGA tumors and adjacent normal tissues. F–I The Kaplan–Meier survival curves of high and low FAM81A expression in GC through the Kaplan–Meier plotter database. (J) The mRNA expression of FAM81A in tumor tissues. K IHC staining of FAM81A in tumor tissues and statistical analysis of staining intensity. Data are presented as mean ± SD. *p < 0.05, **p < 0.01, ***p < 0.001, NS, no significant
Fig. 8
Fig. 8
SQWCF inhibited the PI3K-AKT and MAPK signaling pathways and induced downstream apoptosis pathway. A–B The common enrichment pathways between network pharmacology, transcriptomics, and proteomics. C–D Western blot analysis of the protein expression levels of p-PI3K/PI3K, p-AKT/AKT, p-ERK/ERK, p-JNK/JNK, and p-p38 MAPK/p38 MAPK. E–F Western blot analysis of the protein expression levels of Bad, Bcl-2, Bax, caspase3, cleaved-caspase3, PARP, and cleaved-PARP. G TUNEL staining of the tumor tissues. Data are presented as mean ± SD. *p < 0.05, **p < 0.01, ***p < 0.001, NS, no significant
Fig. 9
Fig. 9
SQWCF combined with paclitaxel inhibited the growth of GC in vivo. A The physical appearance and size of the tumor tissues. B The tumor weight statistics. C The tumor volume statistics. D The body weight statistics. E H&E staining of the tumor tissues. F IHC staining of Ki-67 in tumor tissues. G–H Western blot analysis of the protein expression levels of p-PI3K/PI3K and p-AKT/AKT. I–J Western blot analysis of the protein expression levels of Bad, Bcl-2, Bax, caspase3, cleaved-caspase3, PARP, and cleaved-PARP. Data were presented as mean ± SD. Compared to control: *p < 0.05, **p < 0.01, ***p < 0.001, NS, no significant. Compared to PTX: #p < 0.05, NS, no significant

References

    1. Thrift AP, Wenker TN, El-Serag HB. Global burden of gastric cancer: epidemiological trends, risk factors, screening and prevention. Nat Rev Clin Oncol. 2023;20(5):338–49. - PubMed
    1. Wang F-H, Zhang X-T, Tang L, Wu Q, Cai M-Y, Li Y-F, Qu X-J, Qiu H, Zhang Y-J, Ying J-E, et al. The Chinese Society of Clinical Oncology (CSCO): clinical guidelines for the diagnosis and treatment of gastric cancer, 2023. Cancer Commun (Lond). 2024;44(1):127–72. - PMC - PubMed
    1. Shitara K, Ohtsu A. Advances in systemic therapy for metastatic or advanced gastric cancer. J Natl Compr Canc Netw. 2016;14(10):1313–20. - PubMed
    1. Guan W-L, He Y, Xu R-H. Gastric cancer treatment: recent progress and future perspectives. J Hematol Oncol. 2023;16(1):57. - PMC - PubMed
    1. Yasuda T, Wang YA. Gastric cancer immunosuppressive microenvironment heterogeneity: implications for therapy development. Trends Cancer. 2024;10(7):627–42. - PMC - PubMed

LinkOut - more resources