. 2025 Mar 28;26(1):76.
doi: 10.1186/s13059-025-03536-3.

DEMINERS enables clinical metagenomics and comparative transcriptomic analysis by increasing throughput and accuracy of nanopore direct RNA sequencing

Affiliations

DEMINERS enables clinical metagenomics and comparative transcriptomic analysis by increasing throughput and accuracy of nanopore direct RNA sequencing

Junwei Song et al. Genome Biol. .

Abstract

Nanopore direct RNA sequencing (DRS) is a powerful tool for RNA biology but suffers from low basecalling accuracy, low throughput, and high input requirements. We present DEMINERS, a novel DRS toolkit combining an RNA multiplexing workflow, a Random Forest-based barcode classifier, and an optimized convolutional neural network basecaller with species-specific training. DEMINERS enables accurate demultiplexing of up to 24 samples, reducing RNA input and runtime. Applications include clinical metagenomics, cancer transcriptomics, and parallel transcriptomic comparisons, uncovering microbial diversity in COVID-19 and m6A's role in malaria and glioma. DEMINERS offers a robust, high-throughput solution for precise transcript and RNA modification analysis.

Keywords: Basecalling; Demultiplex; Machine learning; Nanopore direct RNA sequencing; RNA modification.


Conflict of interest statement

Declarations. Ethics approval and consent to participate: Tumour sample collection and the study design were approved by the Biomedical Research Ethics Committee of West China Hospital (Approval number: 2020.837). The research on COVID-19 specimens was approved by the Biomedical Research Ethics Committee of West China Hospital (Approval number 2020.100, 2020.193 and 2020.267). The swabs were obtained for routine diagnostic purposes, and the remaining RNA samples were provided for research. Written consents were obtained from all patients. Consent for publication: Not applicable. Competing interests: Sichuan University has filed patent applications for the methods described herein, with L.C., J.-wL., J.G., J.S., C.T., L.L., and C.C. listed as inventors. The remaining authors declare no competing interests.

Figures
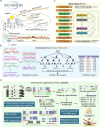
Fig. 1
Fig. 1
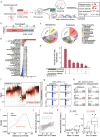
The overview of DEMINERS. a Experimental workflow of barcoding and direct RNA sequencing pipeline. Each sample is ligated to an RNA transcription adapter (RTA) containing an RNA adaptor, a barcode (BC), and poly(T). These barcoded RNA samples are sequenced in a flowcell, producing raw signals of multiplexed barcodes and RNAs. b Schematic illustration of DEMINERS machine-learning classifier based on Random Forest. The current signals of adapters and barcodes were extracted based on the distinct current changes introduced by poly(A) tails. The currents were then segmented into 100 segments/units according to the current changepoints. The normalized and segmented current signals were used as input for barcode classification based on random forest algorithm. c Representation of DEMINERS basecaller built on an optimized convolutional neural network. The basecalling architecture employs an inter-layer connection strategy to foster feature reuse and mitigate the vanishing gradient. The basecaller incorporates a convolutional layer for denoising, followed by max pooling and 4 densely connected convolutional networks (Dense blocks) to decode raw current signals. The 4 dense blocks containing 6, 12, 24, and 16 dense layers, respectively. Then a fully connected layer with a log softmax activation is used for classification and a connectionist temporal classification (CTC) decoder outputs nucleotide sequence. d Overview of downstream applications of DEMINERS. In this study, we show that the DRS reads retrieved by DEMINERS can be used for comprehensive analysis of genes, splice junctions, and isoforms. The splice junctions are corrected and grouped by junctions to construct a new reference. Isoforms are quantified using an expectation–maximization algorithm. By matching the demultiplexed read IDs, the mutations, deletions, poly(A) tail lengths, and RNA modifications can be identified at the single-read level. Additionally, DEMINERS can perform genome assembly for RNA viruses and support meta-genomic/transcriptomic analysis.
Fig. 2
Fig. 2
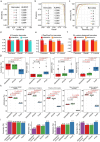
Performance of different demultiplexing and basecalling methods. a,b Receiver Operating Characteristic (ROC) and Precision-Recall (PR) curves showing the performance of DEMINERS in demultiplexing direct RNA-seq (DRS) data generated with 2 to 24 barcodes. AUROC is the area under the ROC curve, and AUPRC is the area under the PR curve. c Accuracy and recovery rates of DEMINERS in demultiplexing DRS data with different numbers of barcodes. The cross symbol represents the cutoff of predicted probability is at 0.5. d Bar charts representing the precision, recall, and F1-score of DEMINERS and Poreplex [51] classifying 4 Poreplex barcodes. e Bar charts representing precision, recall, and F1-score of DEMINERS and DeePlexiCon classifying 4 DeePlexiCon barcodes. f Comparison of DEMINERS and DeePlexiCon [52] classifying 24 custom-designed barcodes. g Box plots of the accuracy, mismatch, deletion, and insertion rates of DEMINERS, RODAN [56], and Guppy in basecalling of the 10-species test set. The boxes show the median and lower/upper quantile, the dots indicate the outliers, and the P values were determined by Wilcoxon test. P values < 0.05 are highlighted in red. h Box plots showing the accuracy of DEMINERS, RODAN, and Guppy in basecalling DRS data of 5 different species. Each dataset was run for 8 times to ensure robustness, and P values were determined by Wilcoxon test. P values < 0.05 are highlighted in red. i Bar chats representing the accuracy, mismatch, deletion, and insertion rates of DEMINERS (mouse-specific and general modes), RODAN, and Guppy.
Fig. 3
Fig. 3
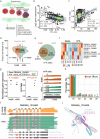
Performance of DEMINERS in pathogen identification, variant calling, and genome assembly of RNA virus from multiplexed RNA samples. a Experimental design to evaluate demultiplexing performance of DEMINERS. The multiplexed samples containing RNA isolated from various pathogens, including RNA viruses, bacteria, fungus, and parasite. b,c Receiver Operating Characteristic (ROC) and Precision-Recall (PR) curves of DEMINERS in demultiplexing the samples of three DRS experiments (Exp). AUROC, the area under the ROC curve; AUPRC, the area under the PR curve. d The accuracy and recovery rates at various predictive probability cutoffs. The red dashed lines indicate a predictive probability cutoff of 0.5. e Pie chart depicting the distribution of species identified in pseudo-metagenomic analysis of the combined 3 DRS datasets. f Integrative genomics viewer (IGV) visualizes genome coverage of Seneca Valley virus (SVV) (7,310 nt) and Porcine Reproductive and Respiratory Syndrome virus (PRRSV) (15,428 nt). Reads longer than 7000 nt for SVV and longer than 15,000 nt for PRRSV are colored in yellow and the number of reads were shown in brackets. g Reproducibility assessment of single-nucleotide variants (SNVs) identified from demultiplexed SVV reads in two DRS experiments (Exp1 and Exp2). Pearson correlation coefficient (R) and relative P value were shown. h IGV visualization of a 3-nt deletion (4022 to 4024) in SVV genome identified by DEMINERS in two experiments. The deleted sequences were boxed in the reference sequence (Ref). The numbers represent the average deletion frequencies. i IGV visualization of a SNV (T-to-A at position 15,307) in PRRSV genome identified by DEMINERS. The reference sequence (Ref) and Sanger sequencing chromatograms depicting the T-to-A variant (arrowhead) were shown. The number represents the frequency of the 'A' variant.
Fig. 4
Fig. 4
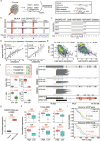
Metagenomic analysis of swab samples by DEMINERS. a Study design. Eleven nasopharyngeal and thirteen oropharyngeal swabs were collected from 24 individuals infected with SARS-CoV-2. The isolated RNA were multiplexed and subjected to DEMINERS followed by metagenomics analysis. Meanwhile, the same individual samples were subjected to next-generation sequencing (NGS) of SARS-CoV-2 genome enriched by multiplex PCR. b Taxonomic classification analysis of the DEMINERS retrieved reads. c Pie charts depicting the distribution of genus bacteria identified in the swab samples. d Bar plot showing the differential distribution of microorganisms in nasopharyngeal (Naso) and oropharyngeal (Oro) swabs. The values represent the mean percentage of each microbial species in Naso samples minus the mean percentage in Oro samples. e UpSet plot showing m6A site overlaps among Nanom6A [13], TandemMod [64], and m6Anet [63]. The bar chart in lower left shows the total number of m6A sites identified by each software, and the lower right chart illustrates the counts of intersecting or unique sites identified by each software. f Distinct ionic current signals indicating RNA modifications at position of 29,385 in SARS-CoV-2 genome. Red lines, SARS-CoV-2 from swab specimens (clinical); black lines, SARS-CoV-2 maintained in vitro culture (IV). g IGV visualization of a SARS-CoV-2 SNV (A-to-C at position 29,510, arrowhead) identified by DEMINERS and NGS in 3 swab samples. The numbers represent the read frequencies of the SNV. h IGV visualization of a 26-nt deletion (29,734 to 29,759) in SARS-CoV-2 genome, identified by DEMINERS and NGS in 3 samples. The average deletion frequencies were shown. i Density plot showing SNV densities flanking the identified m6A sites (red) and random sites (grey). P value, Wilcoxon test. j Scatter plot showing Pearson correlation between Ct value of SARS-CoV-2 N and Orf1ab genes and microbial diversity (Chao1). R, Pearson correlation coefficient; N, relative sample size. k Box plots showing the microbial diversity (Chao1) in nasopharyngeal (Naso-) or oropharyngeal (Oro-) swabs with high-Ct value (Ct > 21) or low-Ct value (Ct ≤ 21). P values were determined by Wilcoxon test.
Fig. 5
Fig. 5
Parallel comparative analysis of transcriptomic features in different stages of malaria parasites. a Schematics of the blood-stage malaria parasites. Trophozoite (troph) and Schizont (schz) stages of parasite were analyzed in this study using DEMINERS. b,c Scatter plot showing Pearson correlation between m6A modification ratios and log2 gene expression or poly(A) tail length across all samples. R, Pearson correlation coefficient; P, P value; N, sample size. d Violin plot showing the distribution of poly(A) tail lengths of all transcripts transcribed in trophozoite or schizont stages. The number of transcripts and the mean poly(A) tail length are shown. P value, Wilcoxon test. e Venn diagram of m6A sites identified in trophozoites and schizonts. f Heatmap illustrating the expression level of ribosome-related genes and their mean m6A modification levels in trophozoites and schizonts. g Point plots showing the normalized gene expression of PBANKA_1245821 and the ratios of m6A (chr12_v3:1,735,101) in trophozoites and schizonts. P values, Wald test for gene expression, T-test for m6A. Reads for gene, the ratio of m6A (marked in red), and PlasmoDB annotation are shown in the right. h Bar charts showing the percentages and numbers of five major types alternative splicing events in trophozoites and schizonts. RI: retained intron, A5: alternative 5' splice site, A3: alternative 3' splice site, SE: skipped exon, AF: alternative first exon. i Sashimi plot and read alignments for PBANKA_1316400 in trophozoites and schizonts. The red boxes indicate the novel exon, the purple boxes indicate the retained introns, and the arrows in the left indicate the reads of novel isoforms. Annotated transcript and novel isoforms with more than 2 DRS reads are shown below. The inversed triangles indicate the predicted start sites the stars indicate the predicted stop site and the numbers in the brackets showing the length of the predicted translated proteins. j Pymol visualization of predicted protein structures of annotated or novel isoforms. The dashed blue box indicates the missing region of novel isoforms, and the dashed purple box highlights missing region of novel isoform 2
Fig. 6
Fig. 6
RNA variants, isoforms and m6A modification in human glioma. a Schematic representation of multiplexed human glioma samples analyzed by DEMINERS. b IGV visualization of a mutation (C-to-T at chr6:29,945,653 in HLA-A ) identified by DEMINERS and NGS in all tumor samples. The numbers represent the read frequencies of the mutations. The Sanger sequencing chromatograms and the reference sequences (Ref) were shown. c IGV visualization of a 5-bp deletion (12,972,603 to 12,972,607 at chr9 in SNORD137 ) identified by DEMINERS. The reference sequence and the average deletion frequencies are shown. d Scatter plot showing Pearson correlation of rlog-normalized gene expression and m6A modification between DEMINERS and single-sample DRS. The boxplots represent binned values of DEMINERS data, while the blue regression lines indicate the linear fit of the data. R, Pearson correlation coefficient; P , relative P value; N , sample size. e Scatter plot showing Pearson correlation between m6A ratio and log2 gene or isoform expression. R, Pearson correlation coefficient; P , relative P value; N , sample size. f Proportions of two isoforms ( GFAP-214 and GFAP-230 ) and their m6A ratios with motif at chr17:44,905,973, chr17:44,906,138, and chr17:44,906,690 in three DMG samples (left). P values, T -test. Total reads for GFAP-214 and GFAP-230 isoforms and m6A sites in DMG samples are shown (right). The colored dots represent the m6A sites and the numbers indicate ratios. The transcript structure based on Ensembl annotation is shown at the bottom, indicating the locations of the associated six splice junctions (SJs). The 6 SJs are located on chr17 with positions of 44,914,089 − 44,915,025 (SJ1), 44,913,824 − 44,914,027 (SJ2), 44,913,431 − 44,913,727 (SJ3), 44,911,798 − 44,913,268 (SJ4), 44,911,457 − 44,911,671 (SJ5), and 44,910,659 − 44,911,235 (SJ6). g Box plot showing the normalized expression of SJ6 in METTL3-KO ( n = 2) and control (n = 2) K562 cells (ENCODE CRISPR RNA-seq data [75]). P value, Wilcoxon test. h Box plots showing normalized expression of 6 SJs of GFAP-214 in high (n = 133) and low (n = 33) expression groups in the TCGA-GBM cohort [76]. P values, Wilcoxon test. i Kaplan–Meier survival curves showing overall survival in the TCGA-GBM cohort [76]. The survival curves were grouped by high (n = 139) and low (n = 25) expression of the GFAP gene (upper panel), or grouped by high ( n = 133) and low (n = 31) expression of 6 SJs of GFAP-214 (lower panel). P values, log-rank test

References

    1. Wang Y, Zhao Y, Bollas A, Wang Y, Au KF. Nanopore sequencing technology, bioinformatics and applications. Nat Biotechnol. 2021;39:1348–65. - PMC - PubMed
    1. Soneson C, Yao Y, Bratus-Neuenschwander A, Patrignani A, Robinson MD, Hussain S. A comprehensive examination of Nanopore native RNA sequencing for characterization of complex transcriptomes. Nat Commun. 2019;10:3359–3314. - PMC - PubMed
    1. Hussain S. Native RNA-Sequencing Throws its Hat into the Transcriptomics Ring. Trends Biochem Sci. 2018;43:225–7. - PubMed
    1. Workman RE, Tang AD, Tang PS, Jain M, Tyson JR, Razaghi R, Zuzarte PC, Gilpatrick T, Payne A, Quick J, Sadowski N, Holmes N, de Jesus JG, Jones KL, Soulette CM, Snutch TP, Loman N, Paten B, Loose M, Simpson JT, Olsen HE, Brooks AN, Akeson M, Timp W. Nanopore native RNA sequencing of a human poly(A) transcriptome. Nat Methods. 2019;16:1297–305. - PMC - PubMed
    1. Ibrahim F, Oppelt J, Maragkakis M, Mourelatos Z. TERA-Seq: true end-to-end sequencing of native RNA molecules for transcriptome characterization. Nucleic Acids Res. 2021;49: e115. - PMC - PubMed

LinkOut - more resources