. 2025 Mar 28;14(1):47.
doi: 10.1186/s40164-025-00626-7.

A one-base therapeutic insertion in the HBG2 distal promoter reactivates γ-globin expression

Affiliations

A one-base therapeutic insertion in the HBG2 distal promoter reactivates γ-globin expression

Xiuqin Bao et al. Exp Hematol Oncol. .

Abstract

Background: The reactivation of developmental silenced γ-globin genes (HBG1/2) has shown promise as a therapeutic strategy for improving symptoms of β-hemoglobinopathies. Currently, the focus of therapeutic targets is primarily on the major fetal hemoglobin suppressors, such as BCL11A and ZBTB7A and of their binding sites on the proximal HBG promoter. However, the role of the distal HBG promoter in regulating gene expression remains to be explored.

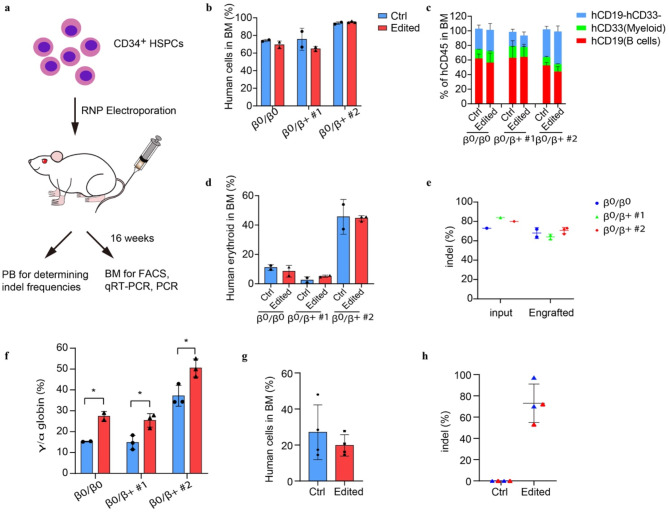
Methods: We used CRISPR/Cas9 system to edit the distal HBG promoter. In vitro and in vivo assays, as well as engrafted NCG-Kit-V831M mice, were used for functional validation and mechanistic studies.

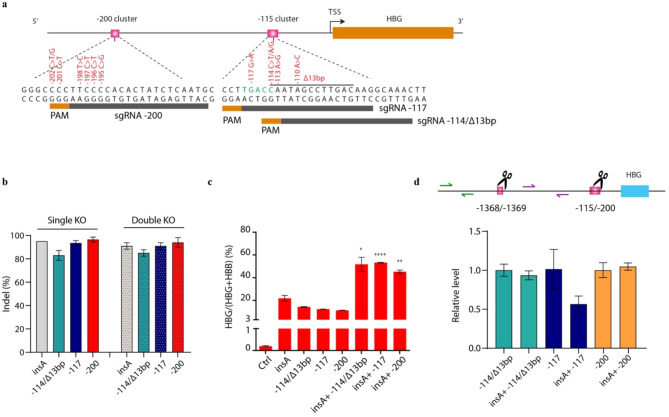
Results: We discovered an insertion of nucleotide A (insA) between - 1368 and - 1369 bp upstream of the TSS in HBG2 resulting in remarkable increase in γ-globin expression in HUDEP-2 cells. We also observed elevated γ-globin expression in human CD34+ erythroid progenitor cells from healthy individuals and those with β-thalassemia when introducing insA mutation. Similarly, engrafted NCG-Kit-V831M mice showed increased γ-globin expression. Importantly, neither did insA have any off-target effects nor did it affect the maturation of erythroid cells. Furthermore, we found that the insA mutation created a binding site for the transcription activator FOXO3, which was activated by AMPK. Additionally, introducing insA specifically demethylated the - 162 CpG site on HBG promoter by reducing the enrichment of DNA methyltransferase 3 A (DNMT3A). At the same time, it activated histone modifications and RNA polymerase II (Pol II) in both distal and proximal HBG promoter and might inhibit the binding of BCL11A and ZBTB7A on -115 and - 200 sites on the HBG promoter respectively. In addition, combination of insA and the - 115 or -200 editing targets resulted in an amplify effect in reactivating γ-globin genes expression.

Conclusions: Overall, we presented the preclinical data to support the role of insA on regulating γ-globin expression using CD34+ HSPC cells derived from healthy donors or patients with β-thalassemia, and subsequently engrafted mice. Our study suggests that introducing insA mutation leads to significantly boosted fetal globin levels and uncovers new safe therapeutic target or strategy for β-hemoglobinopathies.

Keywords: HBG2 distal promoter; CD34+ HSPC cells; FOXO3; Methylation; One-base therapeutic insertion; Therapeutic target; β-thalassemia.


Conflict of interest statement

Declarations. Ethics approval and consent to participate: The healthy donors and patients with β-thalassemia were enrolled in Nanfang Hospital, Southern Medical University, Guangzhou, Guangdong, China. Informed consents were obtained and the performants were complying with relevant ethnic regulations. β-thalassemia patient CD34+ HSPCs were isolated from plerixafor mobilized peripheral blood following Guangdong Women and Children Hospital institutional review board approval and patient informed consent. All animal experiments were approved by the Guangdong Women and Children Hospital Institutional Animal Care and Use Committee. Competing interests: The authors declare no competing interests.

Figures

Fig. 1
Fig. 1
Introducing insA elevates γ-globin expression in HUDEP-2. (a) Indel distribution of HBG2 edited in HUDEP-2 cells analyzed by Synthego webtool after Sanger sequencing. (b-c) Quantitative real-time PCR and western blot analysis of insA HUDEP-2 cells before differentiation. (d-f) Quantitative real-time PCR (d-e) and western blot (f) analysis of insA and insA KO HUDEP-2 clones after 8 days differentiation. (g) Flow cytometry was performed with anti-HbF antibody to detect the HbF cells in insA and insA KO clones. Ctrl indicated control cells edited in the AAVS1 locus. Data from ≥3 independent experiments are presented as mean ± SD (*p < 0.05, ****p < 0.0001)
Fig. 2
Fig. 2
Introducing insA elevates γ-globin expression in CD34+ HSPCs. (a-b) Quantitative measurement of Gγ/Aγ ratio by quantitative real-time PCR (a) and HbF production by western blot (b) in control (Ctrl) and insA CD34+ HSPCs. #1–4 indicated the replicates. (c) Flow cytometry was performed to detect the HbF cells in control and insA CD34+ HSPCs. (d) Statistics result of the HbF cells in control and insA CD34+ HSPCs. (e-f) cell proliferation (e) and cell viability (f) analysis in control and edited CD34+ HSPCs. Ctrl indicated the control cells edited in the AAVS1 locus. (g) Quantitative measurement of HBG mRNA expression by quantitative real-time PCR in control and insA clone CD34+ HSPCs. Data from ≥2 independent experiments are presented as mean ± SD (*p < 0.05, ***p < 0.001, ****p < 0.0001)
Fig. 3
Fig. 3
Introducing insA in β-thalassemia patient HSCs dramatically reactivates γ-globin expression. (a-c) HBG mRNA level measured by qPCR (a, top panel) and Gγ/Aγ ratio measured by RT-PCR (a, bottom panel) and protein levels showed as γ/α and Gγ/Aγ by RP-HPLC (b) and western blot (c) in control and edited CD34+ HSPCs derived from β-thalassemia patient. Data are representative of three to four biologically independent replicates. (d) The representative image of HbF expression cells measured by flow cytometry (left) and statistics result of HbF cells (right) in control and edited cells. (e) Cell viability and cell proliferation rate analysis in control and insA edited cells. (f) The representative image of cell apoptosis rate (top panel) and statistics result in control and edited cells (bottom panel)
Fig. 4
Fig. 4
InsA reactivates γ-globin expression in transplanted mice. (a) The experimental design for in vivo functional variations of insA. sgRNA and Cas9 protein were electroporated into CD34+ HSPCs from three β-thalassemia patient and after 24 h engrafted into immunodeficient mice by intravenous tail injection. Bone marrow (BM) and peripheral blood (PB) were harvested at week 16 after engraftment for further analysis. (b-d) Flow cytometry analysis in mouse BM 16 weeks after transplantation for determination of human engraftment rates (b), human cell multilineage reconstitution (myeloid and B cells, c), and human erythroid cells (d). (e) Determination of the indel frequencies by Synthego analysis after sequencing of PCR products in BM from engrafted mice. (f) Measurement of HBG mRNA expression by quantitative real-time PCR in mouse BM after 16 weeks of engraftment. (g) BM from two mouse each engrafted with unedited control or edited cells (β0+ #2) were transplanted to four secondary immunodeficient mice. After 16 weeks, BM was analyzed for human cell chimerism by flow cytometry. (h) Indel frequencies of insA in BM 16 weeks after secondary transplantation. Data are representative of two to three mice of each group showing as mean ± SD (*p < 0.05, **p < 0.01)
Fig. 5
Fig. 5
InsA mutation creates a de novel site for activator FOXO3. (a) The binding motifs of FOXO3 were identified using JASPAR. (b) Dual luciferase was performed to determine the interaction between FOXO3 and insA. The wild type (WT) or insA-HBG promoter were cloned into the pGL4.18 vector and co-transfected with FOXO3 of pcDNA3.1 into HUDEP-2 cells. (c) EMSA was performed with insA or wild type (WT) hot probe, and indicated fold molar excess of the insA or WT cold probe in HUDEP-2 nuclear extract. Anti-FOXO3 antibody was used to perform super shift-EMSA. (d) ChIP-seq analysis with anti-FOXO3 antibody in WT, insA and insA KO HUDEP-2 clones. The light green shadow indicated the binding peak of FOXO3 on the HBG2 distal promoter. (e) ChIP-qPCR analysis with anti-FOXO3 antibody in control (Ctrl) and insA HUDEP-2 cells. Data from > 3 independent experiments are presented as mean ± SD (**p < 0.01). (f-h) Western blot analysis in FOXO3 knock out (KO) HUDEP-2 control (f) or insA clones (g) on day 8 of the differentiation, and in FOXO3 overexpression (OE) in insA HUDEP-2 clone (h) without differentiation. (i-j) The expression level of IRS1, PIK3R1, PDK2 and AKT1 measured by RNA-seq (i) and qPCR (j) in control, insA and insA KO clones. Data from > 3 independent experiments are presented as mean ± SD (*P < 0.05, **p < 0.01, ***P < 0.001, ns., no significant). (k) Western blot analysis with anti-phosphorylated AMPK (p-AMPK), anti-phosphorylated AKT and FOXO3 ser413 antibodies in control (Ctrl) and insA pool or clone HUDEP-2 cells. GAPDH served as control. (l) Gene ontology (GO) analysis of the identified proteins pulling down by anti-FOXO3 ser413 antibody in control and insA HUDEP-2 cells. BP, biological process; CC, cellular component; MF, molecular function
Fig. 6
Fig. 6
InsA activates chromatin status and reduces methylation in HBG promoter. (a) ATAC-seq results showed the chromosome accessibility of the β-globin cluster. The light green shadow showed the increased chromosome accessibility on the HBG2 promoter. (b) ChIP-seq binding patterns from control or insA HUDEP-2 cells with anti-H3K27ac, anti-H3K4me3, anti-H3K27me3, and Pol II antibodies at the β-globin cluster. The red box indicated the promoter region of HBG. The distal and proximal promoter regions were marked by the light green shadows. (c) Detection of the enrichment of the histone modifications by ChIP-quantitative real-time PCR in human CD34+ HSPCs. Blue bar, control group; red bar, insA group. -, negative control, +, positive control. (d) Top: Analysis of methylation levels at CpG sites (indicated by the distance relative to the transcription start site, TSS) in the HBG promoter, evaluated by sequencing. Data were generated with human CD34+ HSPCs from individuals with β0-thalassemia. Each row of six CpG sites within a group represents a single bisulfite-treated clone with methylated CpGs (●) or unmethylated CpGs (○). Bottom: the statistical results of methylation level of the two indicated groups. (e-g) Analysis of the enrichment of DNMT3A on -162 site (e), BCL11A (f) and ZBTB7A (g) on -115 and − 200 site respectively. -, negative control; +, positive control. Data from ≥2 independent experiments are presented as mean ± SD (*p < 0.05, **p < 0.01, ***p < 0.001, ****p < 0.0001)
Fig. 7
Fig. 7
Multiplex mutagenesis in HUDEP-2 cells amplified the induction of HbF level. (a) Four modified synthetic (MS) sgRNAs respectively targeting − 115 and − 200 on the HBG promoter marked with dark grey boxes. (b) The editing rate of the three sgRNAs and insA sgRNA in HUDEP-2 cells. (c) HBG expression analysis by quantitative real-time PCR in single or multiplex editing in HUDEP-2 cells. Data from 2 biological replicates were showed as mean ± SD (*p < 0.05, **p < 0.01, ***p < 0.001, ****p < 0.0001). (d) Top: diagram showing the HBG region. The CRISPR-Cas9 cleavage sites are indicated by two scissors. qPCR primers targeting the intergenic sequence between the cleavage sites are indicated (purple half arrows). Another pair of primers binding outside of the deletion region are marked by green half arrows and was used as an internal control to adjust for differences in template DNA quality. Bottom: qPCR was performed to detect the deletion of the intergenic sequences. The signals from the intergenic region (purple primers) were normalized to corresponding signals from the outside control region (green primers). Data were calculated by the 2− ΔΔCt approach and shown as fold of change compared to corresponding wild type HUDEP-2 cells

Similar articles

References

    1. Mettananda S, Higgs DR. Molecular basis and genetic modifiers of thalassemia. Hematol Oncol Clin N. 2018;32:177–91. - PubMed
    1. Needs T, Gonzalez-Mosquera LF, Lynch DT. Beta thalassemia. StatPearls. Treasure Island (FL); 2020.
    1. Steinberg MH. Fetal hemoglobin in sickle cell anemia. Blood. 2020;136:2392–400. - PMC - PubMed
    1. Grevet JD, et al. Domain-focused CRISPR screen identifies HRI as a fetal hemoglobin regulator in human erythroid cells. Science. 2018;361:285–90. - PMC - PubMed
    1. Martyn GE, et al. Natural regulatory mutations elevate the fetal globin gene via disruption of BCL11A or ZBTB7A binding. Nat Genet. 2018;50:498–503. - PubMed

LinkOut - more resources