. 2025 Mar 28;26(1):77.
doi: 10.1186/s13059-025-03543-4.

Benchmarking spatial transcriptomics technologies with the multi-sample SpatialBenchVisium dataset

Affiliations

Benchmarking spatial transcriptomics technologies with the multi-sample SpatialBenchVisium dataset

Mei R M Du et al. Genome Biol. .

Abstract

Background: Spatial transcriptomics allows gene expression to be measured within complex tissue contexts. Among the array of spatial capture technologies available is 10x Genomics' Visium platform, a popular method which enables transcriptome-wide profiling of tissue sections. Visium offers a range of sample handling and library construction methods which introduces a need for benchmarking to compare data quality and assess how well the technology can recover expected tissue features and biological signatures.

Results: Here we present SpatialBenchVisium, a unique reference dataset generated from spleen tissue of mice responding to malaria infection spanning several tissue preparation protocols (both fresh frozen and FFPE, with either manual or CytAssist tissue placement). We note better quality control metrics in reference samples prepared using probe-based capture methods, particularly those processed with CytAssist, validating the improvement in data quality produced with the platform. Our analysis of replicate samples extends to explore spatially variable gene detection, the outcomes of clustering and cell deconvolution using matched single-cell RNA-sequencing data and publicly available reference data to identify cell types and tissue regions expected in the spleen. Multi-sample differential expression analysis recovered known gene signatures related to biological sex or gene knockout.

Keywords: 10x Visium; Benchmarking; Differential expression; Multi-sample analysis; Spatial transcriptomics.


Conflict of interest statement

Declarations. Ethics approval and consent to participate: All experiments were performed with ethics approval from the Animal Ethics Committee of the Walter and Eliza Hall Institute of Medical Research. Consent for publication: Not applicable. Competing interests: The authors declare that they have no competing interests.

Figures

Fig. 1
Fig. 1
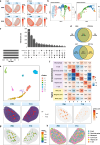
Overview of the experimental workflow, data generated and its analysis. a The mouse spleen and major cell types (B, T and plasma cells, erythrocytes, neutrophils, and macrophages) and structures (germinal centers which are predominantly made up of B cells) expected following infection, which are organized into broader tissue regions (red and white pulp). Figure created with BioRender.com. b 13 samples were captured over 4 10x Genomics Visium OCT slides and 3 FFPE slides, and sequenced over 5 runs on an Illumina NextSeq 2000. Samples are categorized by sex, genotype, tissue preparation protocol, library construction protocol, and tissue placement. A matching scRNA-seq sample of 3 mouse spleens was captured over 1 gel bead-in emulsion (GEM) well, and gene expression and hashtag oligos (HTOs) were sequenced over 1 Illumina run. Subsequent data analysis involved processing with 10x Genomics Space Ranger 2.0.0, and quality control, feature selection, dimensionality reduction, and downstream analysis using various R-based software packages. Figure created with BioRender.com. c Violin plots of UMI counts per spot for all samples, grouped by tissue preparation protocol. The y-axis is on a log10 scale for clarity. d Violin plots of number of genes detected per spot for all samples, grouped by tissue preparation protocol. e A scatterplot showing the fraction of reads captured by spots under tissue against the mean number of reads per spot. The order of experiments is reflected in the shared legend
Fig. 2
Fig. 2
Quality control procedures. a The spatial distribution of UMI counts per spot in FFPE CytAssist (CA) samples 709 and 713. b Quality control metrics for FFPE CA sample 709 following filtering with scater. c Quality control metrics for OCT sample 709 following filtering with scater. d UpSet plot showing the overlap of detected genes in all samples, categorized by sample type. Detected genes are defined as genes with a count of 3 or more in at least 10% of spots. e Venn diagram of genes in all FFPE manual samples, manual and with CA. f Venn diagram of genes in all OCT samples, manual and with CA
Fig. 3
Fig. 3
Summary of downstream analyses. a Top: Spatial expression of the top 2 HVGs for FFPE CA samples. HVGs were identified for each sample, but are shown together here, as the top 2 HVGs were the same in both samples. Bottom: Spatial expression of the top 2 SVGs for FFPE CA samples. These were identified in a single gene list generated through a multi-sample approach. b Clusters identified in each FFPE CA sample following a standard Bioconductor workflow. c UpSet plot showing the overlap of the top 1000 SVGs in each sample type for all wild type (WT) samples. d Venn diagrams showing unique and overlapping SVGs between FFPE samples and between OCT samples, with and without CytAssist, among the top 1000 SVGs. e Top: A UMAP plot showing spatial clusters numbered from 1 to 7) across both FFPE CA samples, identified by iSC.MEB. Bottom: Spatial cluster 7 projected onto tissue images. f Top: A heatmap showing scores for expression of cell type marker gene groups in each cluster (1–7) compared to all other clusters in FFPE CA samples. Bottom: The aggregate gene expression of the T cell marker genes in cluster 7. g A deconvolution plot of confident weights for T cells generated by spacexr for FFPE CA samples. h FFPE CA samples 709 and 713 with annotated spatial clusters following deconvolution and marker gene expression analysis
Fig. 4
Fig. 4
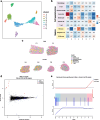
Pseudo-bulk differential expression analyses using biological sex as the ground truth. a A UMAP plot showing clusters identified by iSC.MEB across CTL (male) and WT (female) OCT manual samples. b Heatmap of expression scores generated using marker genes for different cell types or tissue regions expected in the spleen for each spatial cluster compared to all other clusters. c Spatial plot showing spots annotated using cluster maker gene expression from b. d Log-fold-change vs mean expression plot of the differential expression analysis between male and female samples based on pseudo-bulk counts from cluster 2 (annotated as B cell enriched cluster). Sex-specific genes are highlighted in color (red: chromosome Y genes, blue: genes that escape X inactivation in mouse spleen). e Barcode plot of male versus female differential expression (DE) analysis results from pseudo-bulk counts from the B cell cluster (cluster 2), with the ranks of sex-specific genes highlighted in color (red: chromosome Y genes, blue: genes that escape X inactivation in mouse spleen)
Fig. 5
Fig. 5
Pseudo-bulk differential expression analyses of T-bet knockouts. a Spatial plot of KO and CTL OCT manual samples with marker gene based annotated clusters. b Log-fold-change vs mean expression plot of the differential expression analysis between KO and CTL samples based on pseudo-bulk counts from B cell enriched cluster. A signature of differentially expressed genes in T-bet knockout compared to control samples from Ly et al. [29] are highlighted in color (red: upregulated genes, blue: downregulated genes) and T-bet is highlighted by a blue triangle. c Barcode plot of knockout versus control differential expression analysis results from pseudo-bulk counts from the B cell cluster, with the ranks of a set of previously identified differentially expressed genes following knockout of T-bet highlighted in color (red: upregulated genes, blue: downregulated genes)

References

    1. Marx V. Method of the year: spatially resolved transcriptomics. Nat Methods. 2021;1(18):9–14. 10.1038/s41592-020-01033-y. - PubMed
    1. Williams CG, Lee HJ, Asatsuma T, Vento-Tormo R, Haque A. An introduction to spatial transcriptomics for biomedical research. Genome Med. 2022;1(14):68. 10.1186/s13073-022-01075-1. - PMC - PubMed
    1. Chen KH, Boettiger AN, Moffitt JR, Wang S, Zhuang X. Spatially resolved, highly multiplexed RNA profiling in single cells. Science. 2015;4(348):aaa6090. 10.1126/SCIENCE.AAA6090. - PMC - PubMed
    1. Shah S, Lubeck E, Zhou W, Cai L. In situ transcription profiling of single cells reveals spatial organization of cells in the mouse hippocampus. Neuron. 2016;10(92):342–57. 10.1016/j.neuron.2016.10.001. - PMC - PubMed
    1. He S, Bhatt R, Brown C, Brown EA, Buhr DL, Chantranuvatana K, et al. High-plex imaging of RNA and proteins at subcellular resolution in fixed tissue by spatial molecular imaging. Nat Biotechnol. 2022;40:1794–806. 10.1038/s41587-022-01483-z. - PubMed

LinkOut - more resources