

Amniotic fluid-derived mesenchymal stem cells as a therapeutic tool against cytokine storm: a comparison with umbilical cord counterparts
- PMID: 40156072
- PMCID: PMC11951844
- DOI: 10.1186/s13287-025-04262-0
Amniotic fluid-derived mesenchymal stem cells as a therapeutic tool against cytokine storm: a comparison with umbilical cord counterparts
Abstract
Background: Several immunosuppressive therapies have been proposed as key treatment options for critically ill patients since the first appearance of severe acute respiratory syndrome coronavirus 2. Mesenchymal stem cells (MSCs) from different sources have been considered for their potential to attenuate the cytokine storm associated to COVID-19 and the consequent multi-organ failure, providing evidence for safe and efficacious treatments. Among them, administration of umbilical cord-derived MSCs (UC-MSCs) has demonstrated a significant increase in survival rates, largely due to their potent immunosuppressive properties.
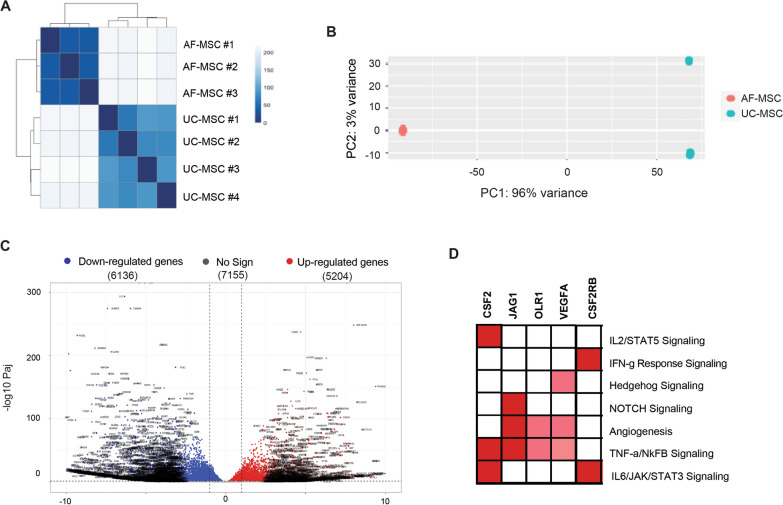
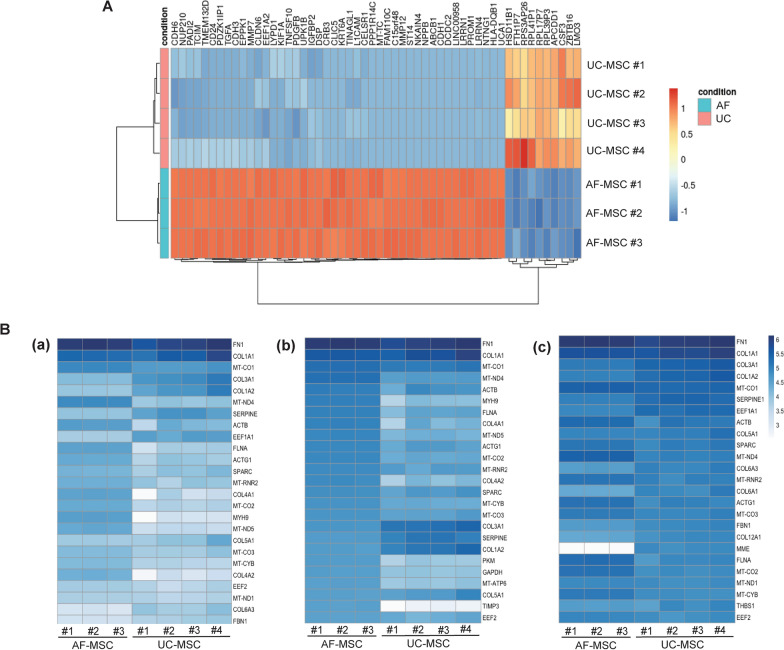
Methods: We applied next-generation sequencing (NGS) analysis to compare the transcriptomic profiles of MSCs isolated from two gestational sources: amniotic fluid (AF) obtained during prenatal diagnosis and their clinically relevant umbilical cord counterparts, for which datasets were publicly available. A full meta-analysis was performed to identify suitable GEO and NGS datasets for comparison between AF- and UC-MSC samples.
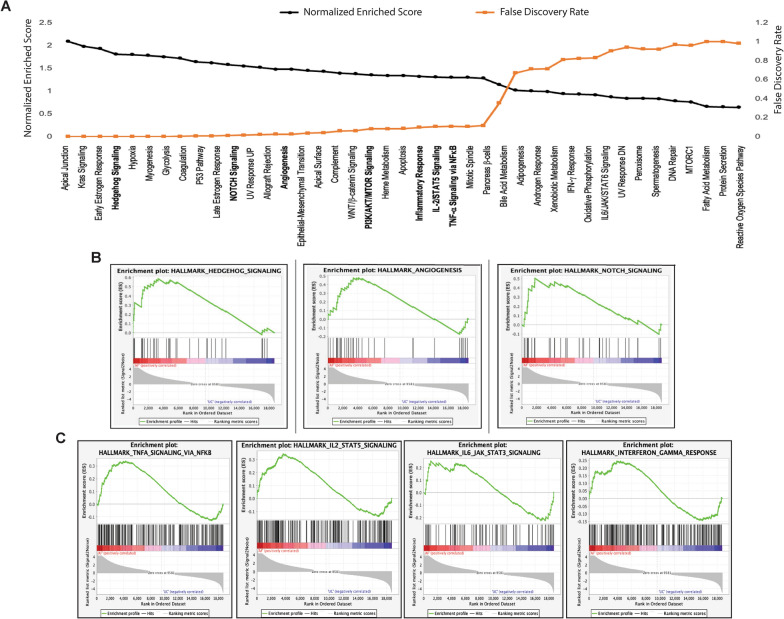
Results: Transcriptome analysis revelaed significant differences between groups, despite both cell lines being strongly involved in the tissue development, crucial to achieve the complex task of wound healing. Significantly enriched hallmark genes suggest AF-MSC superior immunomodulatory features against signaling pathways actively involved in the cytokine storm (i.e., IL-2/STAT, TNF-a/NFkB, IL-2/STAT5, PI3K/AKT/mTOR).
Conclusions: The data presented here suggest that AF-MSCs hold significant promise for treating not only COVID-19-associated cytokine storms but also a variety of other inflammatory syndromes (i.e., those induced by bacterial infections, autoimmune disorders, and therapeutic interventions). Realizing the full potential of AF-MSCs as a comprehensive therapeutic approach in inflammatory disease management will require more extensive clinical trials and in-depth mechanistic studies.
Keywords: Amniotic fluid; COVID-19; Cytokine storm; GSEA; Immunosuppression; Mesenchymal stem cells; Regulatory moieties; Transcriptomic analysis; Umbilical cord.
© 2025. The Author(s).
Conflict of interest statement
Declarations. Ethics approval and consent to participate: This study was conducted on cells isolated at the Cytogenetic Laboratory Children’s Hospital Salesi (Ancona, Italy) in accordance with the Declaration of Helsinki. Samples were obtained for prenatal diagnosis upon informed consent signature from patients for the use of tissue for research purposes (based on d.l.gs. 196/2003 – 101/2018 and privacy protection 8/2016) and ethical approval by the Regional Institutional Review Board (Comitato Etico Regione Marche, Ref. UE 679/2016) on 07/29/2019 [40, 118]. Consent for publication: All authors confirm their consent for publication. Competing interests: The authors declare no competing interests.
Figures
Similar articles
-
Expanded Umbilical Cord Mesenchymal Stem Cells (UC-MSCs) as a Therapeutic Strategy in Managing Critically Ill COVID-19 Patients: The Case for Compassionate Use.Pain Physician. 2020 Mar;23(2):E71-E83. Pain Physician. 2020. PMID: 32214286
-
Mesenchymal stem cells derived from perinatal tissues for treatment of critically ill COVID-19-induced ARDS patients: a case series.Stem Cell Res Ther. 2021 Jan 29;12(1):91. doi: 10.1186/s13287-021-02165-4. Stem Cell Res Ther. 2021. PMID: 33514427 Free PMC article. Clinical Trial.
-
Facing the Challenges in the COVID-19 Pandemic Era: From Standard Treatments to the Umbilical Cord-Derived Mesenchymal Stromal Cells as a New Therapeutic Strategy.Cells. 2023 Jun 19;12(12):1664. doi: 10.3390/cells12121664. Cells. 2023. PMID: 37371134 Free PMC article. Review.
-
Heterogeneous expression of ACE2 and TMPRRS2 in mesenchymal stromal cells.J Cell Mol Med. 2022 Jan;26(1):228-234. doi: 10.1111/jcmm.17048. Epub 2021 Nov 24. J Cell Mol Med. 2022. PMID: 34821008 Free PMC article.
-
Wharton's Jelly Mesenchymal Stem Cell-Derived Extracellular Vesicles Reduce SARS-CoV2-Induced Inflammatory Cytokines Under High Glucose and Uremic Toxin Conditions.Stem Cells Dev. 2021 Aug 1;30(15):758-772. doi: 10.1089/scd.2021.0065. Epub 2021 Jul 5. Stem Cells Dev. 2021. PMID: 34074129 Free PMC article.
References
-
- Cron RQ, Caricchio R, Chatham WW. Calming the cytokine storm in COVID-19. Nat Med. 2021;27(10):1674–5. - PubMed
Publication types
MeSH terms
Substances
LinkOut - more resources
Full Text Sources
Medical
Miscellaneous
