. 2025 Mar;21(3):e70038.
doi: 10.1002/alz.70038.

Diagnostic accuracy of plasma p-tau217/Aβ42 for Alzheimer's disease in clinical and community cohorts

Affiliations

Diagnostic accuracy of plasma p-tau217/Aβ42 for Alzheimer's disease in clinical and community cohorts

Jun Wang et al. Alzheimers Dement. 2025 Mar.

Abstract

Introduction: This study was undertaken to evaluate the diagnostic performance of a novel plasma phosphorylated tau (p-tau) 217/amyloid beta (Aβ) 42 ratio test for Alzheimer's disease (AD).

Methods: The diagnostic performance of the Lumipulse G plasma p-tau217/Aβ42 ratio was evaluated using Aβ and tau positron emission tomography (PET) as reference standards in a clinic cohort (n = 391) and a community cohort (n = 121).

Results: Plasma p-tau217/Aβ42 exhibited high performance for abnormal statuses of Aβ PET (area under the curve [AUC]: 0.963 to 0.966) and tau PET (AUC: 0.947 to 0.974), which were clinically equivalent to those of cerebrospinal fluid (CSF) p-tau181/Aβ42 and Aβ42/Aβ40 and higher than those of blood p-tau217, Aβ42/Aβ40, p-tau181, and p-tau181/Aβ42 in both clinic and community cohorts. Applying a two-cutoff approach improved the specificity without reducing sensitivity. The p-tau217/Aβ42 ratio had a lower intermediate percentage than p-tau217 alone in both clinic (10.6% vs 13.0%) and community (16.5% vs 31.4%) cohorts.

Discussion: Plasma p-tau217/Aβ42 has high performance in detecting cerebral AD pathologies, thus offering a promising tool for clinical diagnosis and community screening of AD.

Highlights: Lumipulse G plasma p-tau217 and the p-tau217/Aβ42 ratio accurately identified abnormal Aβ and tau PET statuses in both clinical and community cohorts. The performance of plasma p-tau217 and p-tau217/Aβ42 ratio were equivalent to CSF tests. Plasma p-tau217/Aβ42 ratio outperformed p-tau217 alone in identifying Aβ PET positivity, and this superiority is more obvious in the community cohort, suggesting an advantage in the early diagnosis of AD. Two cut points of p-tau217/Aβ42 were established in the Chinese population for clinical laboratory and community screening uses.

Keywords: Alzheimer's disease; Lumipulse; amyloid positron emission tomography; blood biomarker; diagnosis; p‐tau217/Aβ42; two‐cutoff approach.


Conflict of interest statement

H.Z. has served on scientific advisory boards and/or as a consultant for AbbVie, Acumen, Alector, Alzinova, ALZPath, Amylyx, Annexon, Apellis, Artery Therapeutics, AZTherapies, Cognito Therapeutics, CogRx, Denali, Eisai, LabCorp, Merry Life, Nervgen, Novo Nordisk, Optoceutics, Passage Bio, Pinteon Therapeutics, Prothena, Red Abbey Labs, reMYND, Roche, Samumed, Siemens Healthineers, Triplet Therapeutics, and Wave and has given lectures at symposia sponsored by Alzecure, Biogen, Cellectricon, Fujirebio, Lilly, Novo Nordisk, and Roche. The other authors declare no competing interests. Author disclosures are available in the Supporting information.

Figures

FIGURE 1
FIGURE 1
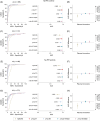
Correlations of plasma biomarkers with Aβ and tau PET. (A and B) Correlations of plasma biomarkers with brain Aβ burden quantified by Centiloids (A) and tau burden quantified by temporal meta‐ROI CenTauRz (B) in CADS cohort. (C and D) Correlations of plasma biomarkers with brain Aβ burden quantified by neocortical SUVR of D3FSP tracer (C) and tau burden by temporal meta‐ROI SUVR of AV1451 tracer (D) in the GHABS cohort. Aβ, amyloid beta; CADS, Chongqing Ageing & Dementia Study; GHABS, Greater‐Bay‐Area Healthy Aging Brain Study; PET, positron emission tomography; ROI, region of interest; SUVR, standardized uptake value ratio.
FIGURE 2
FIGURE 2
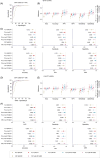
Performance of plasma biomarkers in classification of Aβ and tau PET statuses by visual read. (A, C, E, G) ROC curve and AUC of plasma biomarkers in classification of Aβ (A and C) and tau PET (E and G) status in the entire CADS (A and E) and GHABS (C and G) cohorts. Vertical dashed lines: AUC = 1. (B, D, F, H) Bootstrapped differences (n = 1000 resamples with replacement stratifying by output) between statistics using plasma p‐tau217 (reference) and other plasma biomarkers in CADS (B and F) and GHABS (D and H). Horizontal dashed line plotted at zero: lack of difference between plasma p‐tau217 and other plasma biomarkers. Other plasma biomarkers were considered to be clinically equivalent to p‐tau217 if the 95% CI of the mean difference included zero and clinically superior (>0) or inferior (<0) if it did not include zero. The dots and error bars represent the actual statistics and 95% CIs (from bootstrapped n = 1000 samples with replacement), respectively. AUC, area under the curve; CADS, Chongqing Ageing & Dementia Study; CI, confidence interval; GHABS, Greater‐Bay‐Area Healthy Aging Brain Study; PET, positron emission tomography; p‐tau, phosphorylated tau; ROC, receiver operating characteristic.
FIGURE 3
FIGURE 3
Frequency distribution of plasma biomarkers in CADS and GHABS cohorts. Histograms represent distribution of data colored by Aβ and tau PET imaging status. Vertical black line: threshold derived from single‐cutoff approach; red lines: lower and upper thresholds from two‐cutoff approach. Aβ and tau PET positivity were assessed by visual read method. Aβ, amyloid beta; PET, positron emission tomography.
FIGURE 4
FIGURE 4
Head‐to‐head comparisons between plasma and CSF biomarkers for identifying Aβ and tau PET positivity in the CSF subset of CADS cohort. (A and D) ROC curves of plasma and CSF biomarkers for identifying Aβ (A) and tau (D) PET positivity by visual read. (B and E) Bootstrapped differences (n = 1000 resamples with replacement stratifying by output) in statistics between FDA‐approved CSF Aβ42/40 (reference) and other CSF and plasma biomarkers. The horizontal dashed line plotted at zero represents the lack of difference between CSF Aβ42/40 and other biomarkers. Other CSF and plasma biomarkers were considered to be clinically equivalent to CSF Aβ42/40 if the 95% CI of the mean difference included zero and clinically superior (>0) or inferior (<0) if it did not include zero. (C and F) AUC and other diagnostic metrics of plasma and CSF biomarkers for identifying Aβ (C) and tau (F) PET positivity. Dots and error bars represent the mean and 95% CI estimates from a bootstrapped sample. Aβ, amyloid beta; AUC, area under the curve; CI, confidence interval; CSF, cerebrospinal fluid; NPV, negative predictive value; PPV, positive predictive value; PLA, plasma; ROC, receiver operating characteristic.
FIGURE 5
FIGURE 5
The two‐cutoff approach improved the diagnostic performance of plasma biomarkers in the entire CADS and GHABS cohorts. (A, D, G, J) Diagnostic metrics of plasma biomarkers for identifying Aβ (A and D) and tau (G and J) PET positivity in CADS (A and G) and GHABS (D and J) cohorts by the single‐cutoff and two‐cutoff approaches, respectively. In the single‐cutoff approach, the threshold was calculated using the maximum Youden index. In the two‐cutoff approach, the lower threshold was obtained by maximizing specificity with sensitivity fixed at 95%, whereas the upper threshold was obtained by maximizing sensitivity while fixing specificity at 95%. Dots and error bars represent the mean and 95% CI estimates from a bootstrapped sample. (B, E, H, K) Percentages (with a 95% CI estimate from a bootstrapped sample) of participants who fell into the gray zone between two cutoffs were classified in the intermediate group. (C, F, I, L) Bootstrapped differences (n = 1000 resamples with replacement stratifying by the output) in the statistics between plasma p‐tau217 (reference) and other plasma biomarkers for both the single‐cutoff and two‐cutoff approaches. The horizontal dashed line plotted at zero represents the lack of difference between plasma p‐tau217 and other biomarkers. Other plasma biomarkers were considered to be clinically equivalent to p‐tau217 if the 95% CI of the mean difference included zero and clinically superior (>0) or inferior (<0) if it did not include zero. CADS, Chongqing Ageing & Dementia Study; CI, confidence interval; CSF, cerebrospinal fluid; GHABS, Greater‐Bay‐Area Healthy Aging Brain Study NPV, negative predictive value; PPV, positive predictive value; p‐tau, phosphorylated tau.
FIGURE 6
FIGURE 6
The two‐step workflow of predicting amyloid pathology based on plasma p‐tau217/Aβ42 ratio in clinical and community settings. Use of two cutoff values for Lumipulse plasma p‐tau217/Aβ42 test in patients with cognitive symptoms in clinics and in community‐based at‐risk populations leads to three categories of results: positive, intermediate, and negative, increasing the accuracy with which people can be classified as having or not having amyloid pathology. BBM, blood‐based biomarker; CI, cognitively impaired; CU, cognitively unimpaired; NPV, negative predictive value; PPV, positive predictive value; p‐tau, phosphorylated tau; Se, sensitivity; Sp, specificity.

References

    1. 2023 Alzheimer's disease facts and figures. Alzheimers Dement. 2023;19(4):1598‐1695. - PubMed
    1. Li WW, Shen YY, Tian DY, et al. Brain amyloid‐beta deposition and blood biomarkers in patients with clinically diagnosed Alzheimer's disease. J Alzheimers Dis. 2019;69(1):169‐178. - PubMed
    1. Rabinovici GD, Gatsonis C, Apgar C, et al. Association of amyloid positron emission tomography with subsequent change in clinical management among medicare beneficiaries with mild cognitive impairment or dementia. JAMA. 2019;321(13):1286‐1294. - PMC - PubMed
    1. Liu Z, Shi D, Cai Y, et al. Pathophysiology characterization of Alzheimer's disease in South China's aging population: for the Greater‐Bay‐Area Healthy Aging Brain Study (GHABS). Alzheimers Res Ther. 2024;16(1):84. - PMC - PubMed
    1. van Dyck CH, Swanson CJ, Aisen P, et al. Lecanemab in early Alzheimer's disease. N Engl J Med. 2023;388(1):9‐21. - PubMed