. 2025 Apr 15;6(4):102043.
doi: 10.1016/j.xcrm.2025.102043. Epub 2025 Mar 28.

A spatially resolved transcriptome landscape during thyroid cancer progression

Affiliations

A spatially resolved transcriptome landscape during thyroid cancer progression

Tian Liao et al. Cell Rep Med. .

Abstract

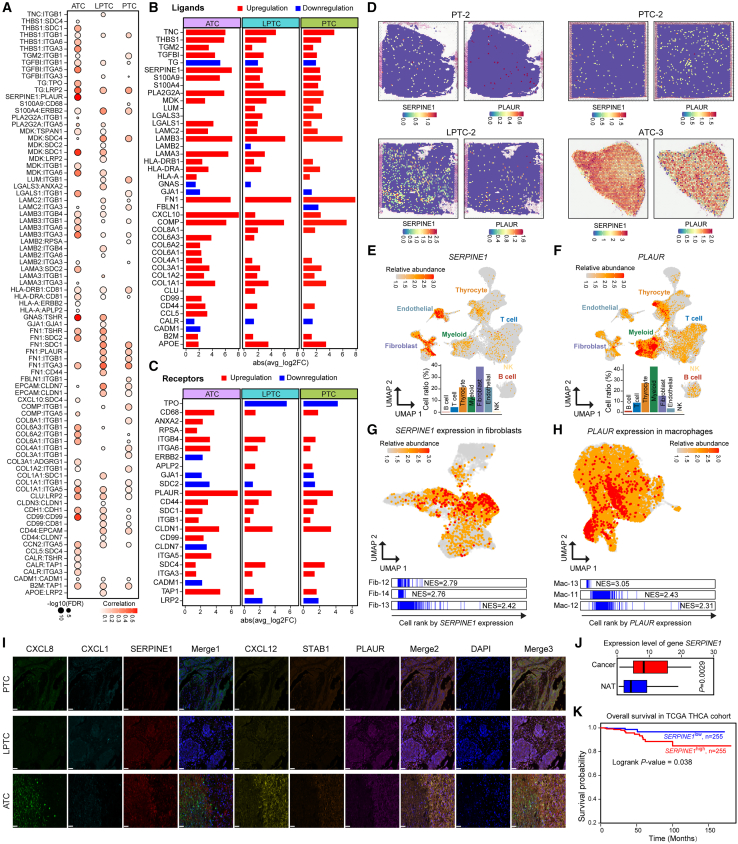
Tumor microenvironment (TME) remodeling plays a pivotal role in thyroid cancer progression, yet its spatial dynamics remain unclear. In this study, we integrate spatial transcriptomics and single-cell RNA sequencing to map the TME architecture across para-tumor thyroid (PT) tissue, papillary thyroid cancer (PTC), locally advanced PTC (LPTC), and anaplastic thyroid carcinoma (ATC). Our integrative analysis reveals extensive molecular and cellular heterogeneity during thyroid cancer progression, enabling the identification of three distinct thyrocyte meta-clusters, including TG+IYG+ subpopulation in PT, HLA-DRB1+HLA-DRA+ subpopulation in early cancerous stages, and APOE+APOC1+ subpopulation in late-stage progression. We reveal stage-specific tumor leading edge remodeling and establish high-confidence cell-cell interactions, such as COL8A1-ITHB1 in PTC, LAMB2-ITGB4 in LPTC, and SERPINE1-PLAUR in ATC. Notably, both SERPINE1 expression level and SERPINE1+ fibroblast abundance correlate with malignant progression and prognosis. These findings provide a spatially resolved framework of TME remodeling, offering insights for thyroid cancer diagnosis and treatment.

Keywords: cell-cell interactions; single-cell transcriptomics; spatial transcriptomics; thyroid cancer; tumor leading-edge regions.


Conflict of interest statement

Declaration of interests The authors declare no competing interests.

Figures

None
Graphical abstract
Figure 1
Figure 1
Spatial transcriptomics analysis of thyroid cancer (A) Schematic overview of the experimental design. (B) Uniform manifold approximation and projection (UMAP) projection of all spatial transcriptomic spots from the PT (n = 4), PTC (n = 5), LPTC (n = 4), and ATC (n = 4) samples combined. (C) Violin plots showing the distribution of the number of UMIs and expressed genes per spot across all samples (n = 17). (D) UMAP plots illustrating the distribution of the number of expressed genes within PT, PTC, LPTC, and ATC groups. (E) Heatmap of top 10 most variably expressed genes across the four sample groups. (F) GSEA enrichment of hallmark pathways based on the ranked fold changes in gene expression for each cancer group compared to the others. See also Figure S1 and Tables S1 and S2.
Figure 2
Figure 2
Clustering analysis of spatial transcriptomics data (A) Clusters of ST spots identified in PT, PTC, LPTC, and ATC samples. The top panels show H&E-stained tissue sections, while the bottom panels highlight the spatial distribution of ST clusters. The UMAP plot on the bottom right displays the global distribution of ST clusters. (B) Bubble plot showing the expression levels of top marker genes for scRNA-seq-defined cell types across the identified ST clusters. (C) UMAP plots illustrating signature scores for major cell types across all ST spots. The insert bar plots depict the distribution of spot counts across different ratio ranges. (D) Pie charts indicating the percentage composition of major cell types within each ST cluster. (E) Bar plots showing the distribution of these cell types across the different sample groups. (F) Representative examples of the spatial distribution of defined cell types in samples PT-4, PTC-4, LPTC-3, and ATC-1. See also Figures S1 and S2 and Table S2.
Figure 3
Figure 3
Characteristics of thyrocyte subpopulations (A) UMAP projection illustrating the clustering of thyrocyte subpopulations. (B) Relative expression levels of key marker genes across all identified thyrocyte subpopulations. (C) Bar plots showing the percentage distribution of each thyrocyte subpopulation within PT, PTC, LPTC, and ATC groups. (D) Spatial distributions of thyrocyte subpopulations in representative samples PT-1, PTC-3, LPTC-3, and ATC-4. (E) Dot plot indicating the enrichment of hallmark biological processes in each thyrocyte subpopulation. (F–H) Boxplots showing the distribution of TDS (F), BRAF (G), and RAS (H) scores across thyrocyte subpopulations. Data are represented as the interquartile range (IQR) and median scores in each thyrocyte subpopulation; whiskers indicated 1.5 times IQR. p, two-sided Wilcoxon’s rank-sum test p value. See also Figure S3 and Table S3.
Figure 4
Figure 4
Evolutionary trajectory of thyrocyte subpopulations in thyroid cancer progression (A) UMAP plot illustrating the distribution of pseudo-time values across all thyrocytes. (B) Boxplots showing pseudo-time values for each thyrocyte subpopulation, sorted by median pseudo-time from low to high. Data are represented as the IQR and median pseudo-time values in each thyrocyte subpopulation; whiskers indicated 1.5 times IQR. (C–E) Scatterplots depicting the correlations of pseudo-time with TDS (C), RAS (D), and BRAF (E) scores. (F) Average silhouette widths for various cluster numbers, indicating cluster quality. (G) Cluster dendrogram identifying three distinct thyrocyte meta-clusters. (H) Bubble plot showing the relative expression of selected marker genes across the three thyrocyte meta-clusters. (I) Heatmap illustrating the distribution of stromal cell subpopulations surrounding meta-cluster 1, 2, and 3 thyrocytes, with values scaled by row (Z scores). (J) Spatial feature plots displaying the proximity of Fib-3 and Fib-10 fibroblast subpopulations to meta-cluster 1, 2, and 3 thyrocytes in an ATC sample. (K) Heatmap revealing the distribution of immune cell subpopulations around meta-cluster 1, 2, and 3 thyrocytes, with values scaled by row (Z scores). (L) Spatial feature plots highlighting the localization of Mac-6 and Mac-11 macrophage subpopulations surrounding meta-cluster 1, 2, and 3 thyrocytes in an ATC sample. See also Figure S4 and Table S3.
Figure 5
Figure 5
Comparative characterization of tumor leading-edge regions in PTC, LPTC, and ATC samples (A) H&E-stained tissue sections and spatial feature plots indicating regions of normal tissue, tumor tissue, and tumor leading edges (LEs) in representative samples. (B) Pie charts depicting the percentage composition of various cell types within the leading-edge regions. (C) H&E staining and spatial feature maps showing the distribution of different cell types at leading edges of representative PTC-3, LPTC-3, and ATC-4 samples. (D–F) Lollipop plot illustrating the prevalence of individual thyrocyte (D), fibroblast (E), and macrophage (F) subpopulations within normal, leading-edge, and tumor regions across PTC, LPTC, and ATC samples. Prevalence was determined using the observed-to-expected (O/E) cell number ratio from chi-squared tests. (G) Ordered point plot showing the log2-transformed fold change in gene expression between spots in tumor leading-edge regions and those in normal regions for PTC, LPTC, and ATC samples. (H) Venn diagram illustrating overlapping sets of upregulated (left) and downregulated (right) genes shared among PTC, LPTC, and ATC groups. (I) GSEA results for gene sets ranked as in (G) in PTC, LPTC, and ATC groups, respectively. See also Figure S5 and Table S4.
Figure 6
Figure 6
Cell-cell communications in thyroid cancer (A) Bubble plot illustrating the spatial correlations of dysregulated ligand-receptor pairs between PTC, LPTC, or ATC and PT samples in the ST data. (B and C) Bar plots showing fold changes in ligand (B) and receptor (C) expression in PTC, LPTC, and ATC samples compared to PT samples. (D) Spatial feature plots highlighting SERPINE1 (ligand) and PLAUR (receptor) expression in representative samples (PT-2, PTC-2, LPTC-2, and ATC-3). (E and F) Expression levels of SERPINE1 (E) and PLAUR (F) across various cell types. (G) SERPINE1 expression within fibroblasts, with the inset indicating enrichment of fibroblast subpopulations stratified by SERPINE1 expression levels. (H) PLAUR expression within macrophages, with the inset showing enrichment of macrophage subpopulations stratified by PLAUR expression levels. (I) Multiplex immunofluorescence staining for Fib-12 fibroblast markers (CXCL8, CXCL1, and SERPINE1) and Mac-11 macrophages (CXCL12, STAB1, and PLAUR) in PTC, LPTC, and ATC samples. Scale bar: 40 μm. (J) Boxplot comparing SERPINE1 expression in cancer (n = 58) versus paired NAT (n = 58) samples from the TCGA thyroid carcinoma (THCA) cohort. (K) Kaplan-Meier survival curve from the TCGA THCA cohort (n = 510) showing patient survival based on median SERPINE1 expression levels. See also Figure S6 and Tables S5 and S6.

References

    1. Siegel R.L., Miller K.D., Wagle N.S., Jemal A. Cancer statistics, 2023. CA Cancer J. Clin. 2023;73:17–48. doi: 10.3322/caac.21763. - DOI - PubMed
    1. Sung H., Ferlay J., Siegel R.L., Laversanne M., Soerjomataram I., Jemal A., Bray F. Global Cancer Statistics 2020: GLOBOCAN Estimates of Incidence and Mortality Worldwide for 36 Cancers in 185 Countries. CA Cancer J. Clin. 2021;71:209–249. doi: 10.3322/caac.21660. - DOI - PubMed
    1. Chen D.W., Lang B.H.H., McLeod D.S.A., Newbold K., Haymart M.R. Thyroid cancer. Lancet. 2023;401:1531–1544. doi: 10.1016/S0140-6736(23)00020-X. - DOI - PubMed
    1. Pizzato M., Li M., Vignat J., Laversanne M., Singh D., La Vecchia C., Vaccarella S. The epidemiological landscape of thyroid cancer worldwide: GLOBOCAN estimates for incidence and mortality rates in 2020. Lancet Diabetes Endocrinol. 2022;10:264–272. doi: 10.1016/S2213-8587(22)00035-3. - DOI - PubMed
    1. Huang N.S., Li Q., Gao X.Y., Xiang S.Y., Ji Q.H., Xiang J., Wang Y.L., Wei W.J., Chen J.Y., Yu Q., et al. Using a CT-based scale to evaluate disease extension and the resectability of locally advanced thyroid cancer. Eur. Radiol. 2023;33:9063–9073. doi: 10.1007/s00330-023-09799-3. - DOI - PubMed

MeSH terms

Substances