. 2025 Mar 29;15(1):10883.
doi: 10.1038/s41598-025-95533-6.

The specific contributions of factor H and factor I in controlling fluid phase activation of the alternative complement pathway

Affiliations

The specific contributions of factor H and factor I in controlling fluid phase activation of the alternative complement pathway

Nancy A Turner et al. Sci Rep. .

Abstract

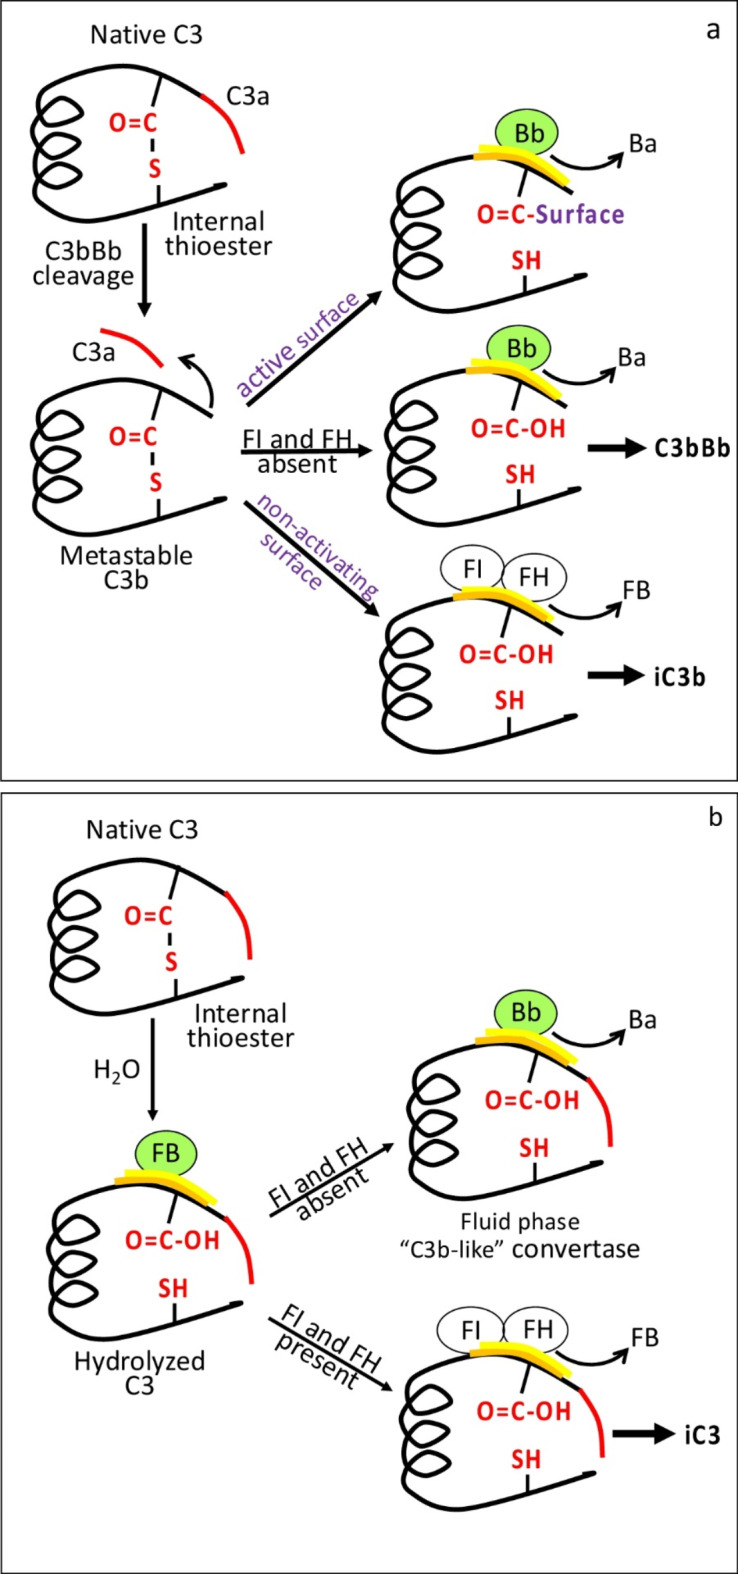
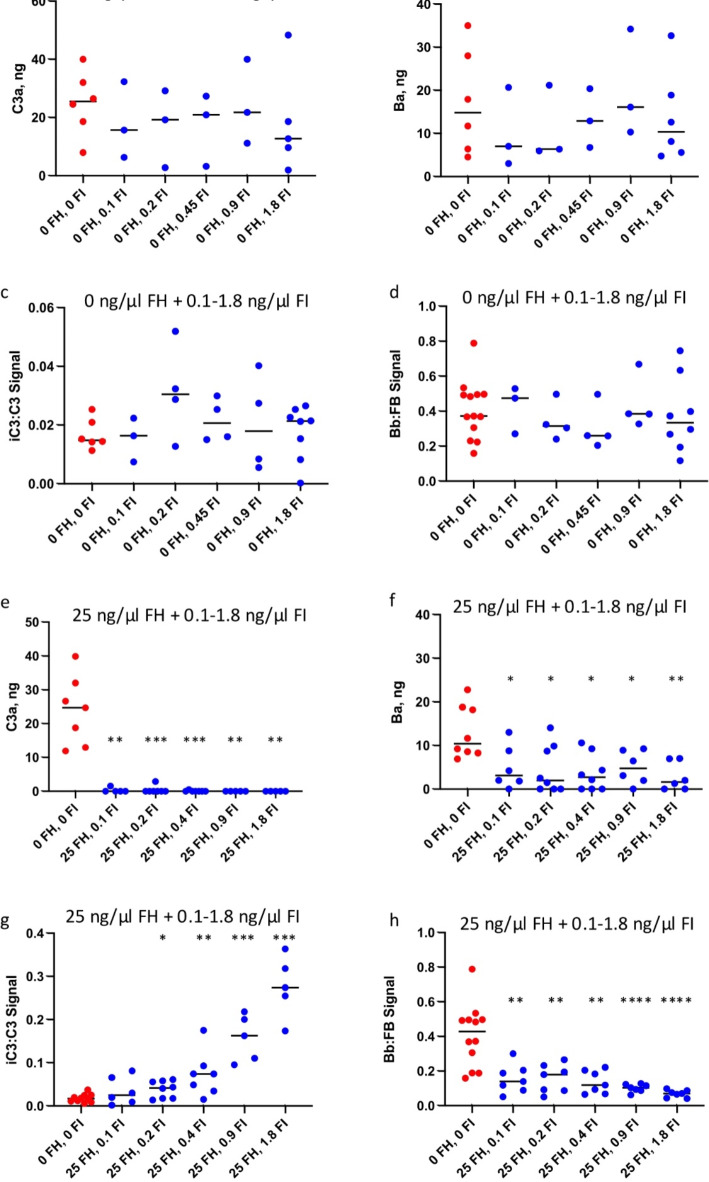
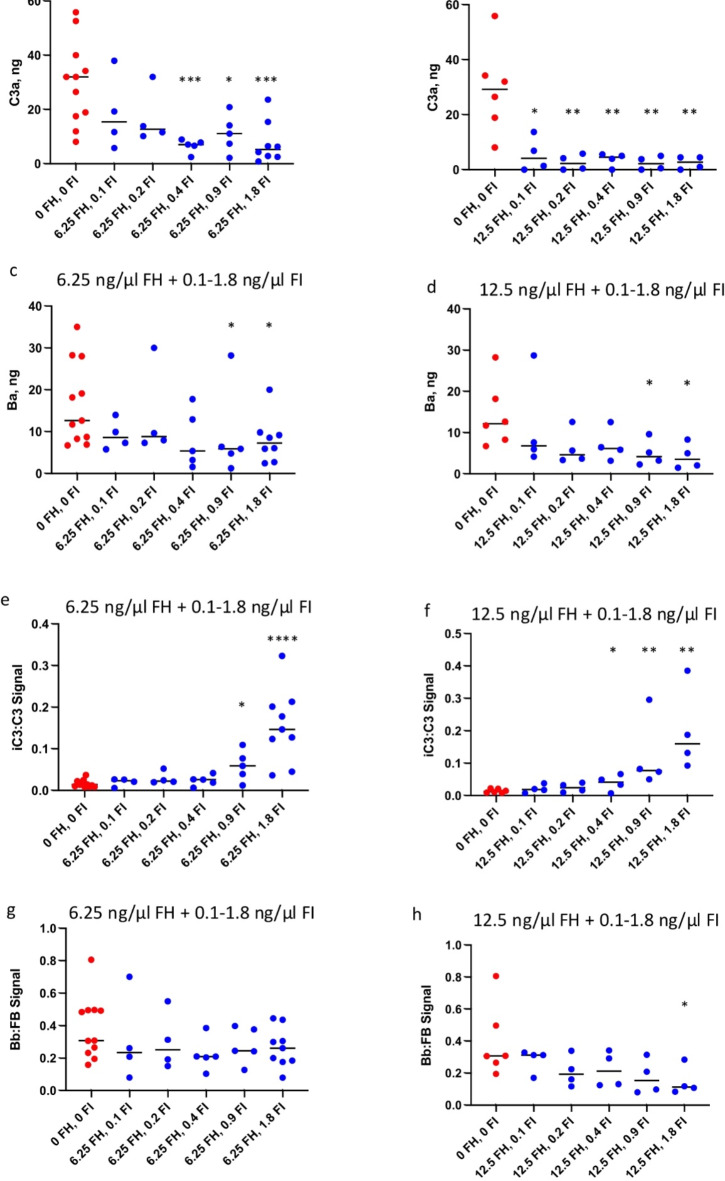
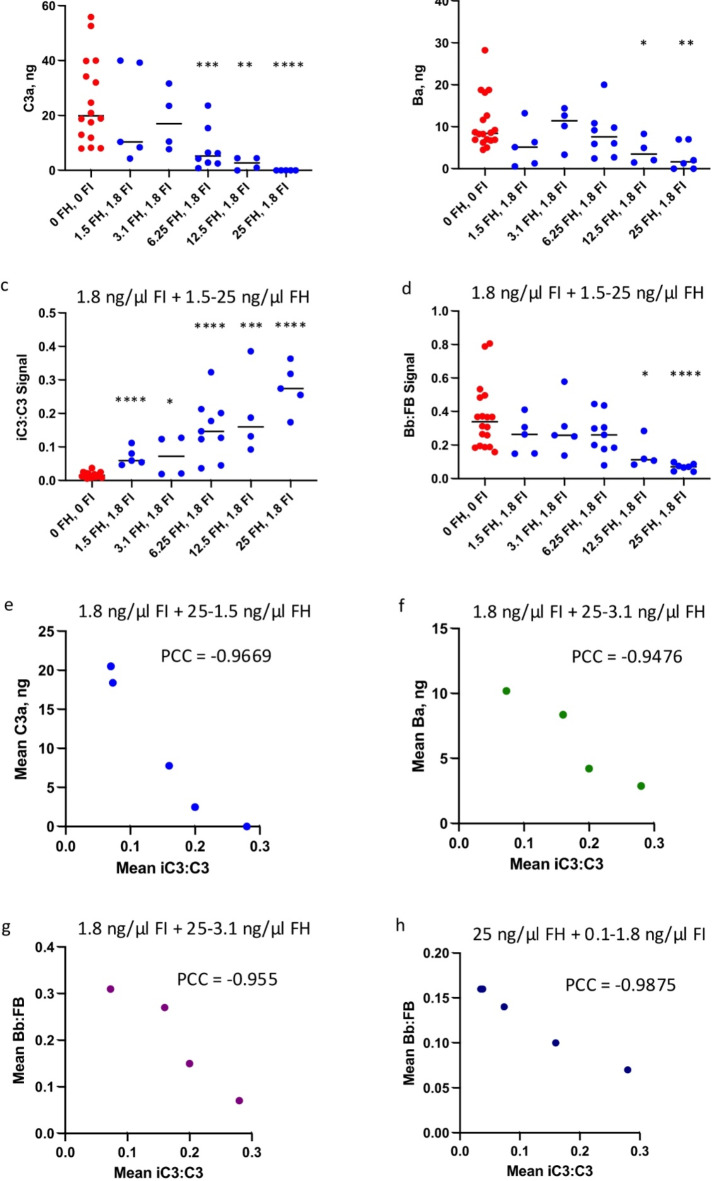
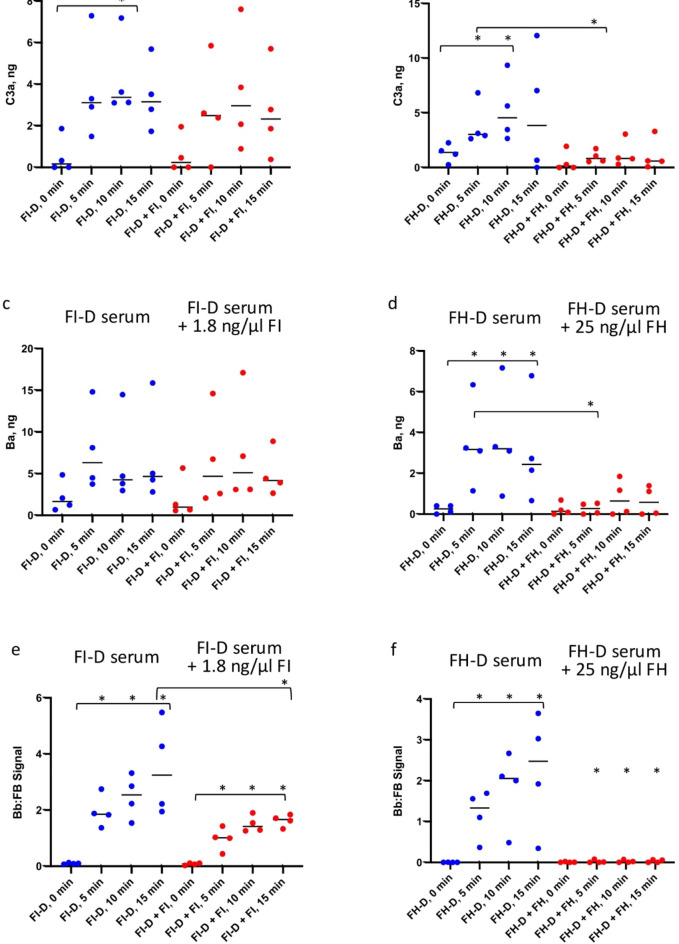
The immediate defense provided by the alternative complement pathway (AP) is under constant control by fluid phase regulators, factor H (FH) and factor I (FI), to prevent nonessential activation. Removal of either FI or FH from serum results in spontaneous AP activation, although the extent of activation caused by separate removal of each regulator has not been compared. In purified protein reactions with < 25% normal FH levels, additions of 6-100% normal FI levels, did not reduce C3a, Ba or FB cleavage. In reactions with 100% FH: C3a was not generated; Ba and FB cleavage was 3-fold lower; and C3 inactivation increased 2-fold as FI concentrations doubled. In reactions with 100% FI, FH levels ≥ 25% reduced C3a and Ba levels. AP activation levels were also compared in FI-depleted and FH-depleted serum. After magnesium addition to FI-depleted serum, C3a remained unchanged and Ba increased 3-fold, whereas in FH-depleted serum, C3a increased 13-fold and Ba increased 20-fold. Addition of 100% FI protein to FI-depleted serum did not change C3a and Ba, whereas, 100% FH added to FH-depleted serum prevented all activation. We conclude that normal levels of FH are sufficient to compensate for FI deficiencies and prevent unnecessary fluid phase AP activation.


Conflict of interest statement

Declarations. Competing interests: The authors declare no competing interests.

Figures

Fig. 1
Fig. 1
Schematic diagram of fluid-phase activation and inactivation of C3. In the fluid phase, a conformer of C3 exists in a hydrolyzed configuration, structurally distinct from native C3, that is capable of participating in AP activation. (a) The internal thioester within the alpha-chain of native C3 is exposed after cleavage and release of C3a by the C3 convertase (C3bBb), producing metastable C3b. Three possibilities exist for the short-lived metastable C3b. In the presence of an activating surface, C3b covalently binds to hydroxyl groups on the target surface. If FI and FH are absent, there is formation of the fluid-phase C3 convertase (C3bBb) and the potential of uncontrolled AP activation. In the absence of a foreign target, C3b reacts with water and is quickly cleaved and inactivated by FI, with co-factor FH, producing iC3b. (b) Water hydrolysis of the internal thioester converts native C3 to hydrolyzed C3 [C3(H2O)], a functionally C3b-like protein with FB binding capacity without previous cleavage of C3a. In the absence of FI and FH, C3(H2O) binds FB, and after FB cleavage by FD, forms an active fluid phase C3 convertase capable of cleaving C3 to C3b, although unable to bind to surfaces because the thioester remains unexposed. In the presence of both FI and FH, FB is displaced by FH and C3(H2O) is directly cleaved and inactivated by FI, resulting in iC3. Adapted from Pangburn and Muller-Eberhard.
Fig. 2
Fig. 2
AP activation in purified protein reactions with increasing FI concentrations in the absence of FH or presence of 100% FH. Activation in reactions using purified proteins C3, FB, FD in either the absence of FH or with 100% FH (25 ng/µl) and increasing FI concentrations (0.1–1.8 ng/µl) was measured by Western blotting. Measurements in (a-d) are from reactions in the absence of FH for: (a) C3a; (b) Ba; (c) C3 inactivation and (d) FB cleavage. Measurements in (e-h) are from reactions with 100% FH for: (e) C3a; (f) Ba; (g) C3 inactivation; and (h) FB cleavage. Graphs show individual values with the median indicated by the horizontal bar from the analysis of 3–12 reactions of each composition. Statistical significance is shown for values (blue circles) compared to measurements in reactions without either FH or FI (red circles). In (e) C3a: 0 FI vs. 0.1, 0.9, 1.8 ng/µl FI, P = 0.0025; 0 FI vs. 0.2 and 0.4 ng/µl FI, P = 0.0006; in (f) Ba: (0 FI vs. 0.1 ng/µl FI, P = 0.0426; 0 FI vs. 0.2 ng/µl FI, P = 0.0373; 0 FI vs. 0.4 ng/µl FI, P = 0.0103; 0 FI vs. 0.9 ng/µl FI, P = 0.0293; 0 FI vs. 1.8 ng/µl FI, P = 0.0027; in (g) C3 inactivation: 0 FI vs. 0.2 ng/µl FI, P = 0.0343, 0 FI vs. 0.4 ng/µl FI, P = 0.0046, 0 FI vs. 0.9, 1.8 ng/µl FI, P = 0.0007; and in (h) FB cleavage: 0 FI vs. 0.1 ng/µl FI, P = 0.0026, 0 FI vs. 0.2 ng/µl FI, P = 0.0052, 0 FI vs. 0.4 ng/µl FI, P = 0.0018, 0 FI vs. 0.9, 1.8 ng/µl FI, P < 0.0001.
Fig. 3
Fig. 3
AP activation in purified protein reactions with either 25% or 50% FH and increasing FI concentrations. Activation in reactions using purified proteins C3, FB, FD with either 25% FH (6.25 ng/µl) or 50% FH (12.5 ng/µl) and increasing FI concentrations (0.1–1.8 ng/µl) was measured by Western blotting. Graphs show measurements for: (a) C3a with 25% FH (b) C3a with 50% FH; (c) Ba with 25% FH; (d) Ba with 50% FH; (e) C3 inactivation with 25% FH; (f) C3 inactivation with 50% FH; (g) FB cleavage with 25% FH; and (h) FB cleavage with 50% FH. Graphs show individual values with the median indicated by the horizontal bar from 4–11 reactions of each composition. Statistical significance is shown for values (blue circles) compared to measurements in reactions without either FH or FI (red circles). In (a) 25% FH: 0 FI vs. 0.4 ng/µl FI, P = 0.0009; 0 FI vs. 0.9 ng/µl FI, P = 0.0181, 0 FI vs. 1.8 ng/µl FI, P = 0.0007; in (b) 50% FH: 0 FI vs. 0.1 ng/µl FI, 0 FI vs. 0.2, 0.4, 0.9 and 1.8 ng/µl FI, P = 0.0095; in (c) 25% FH: 0 FI vs. 0.9 ng/µl FI, P = 0.0381, 0 FI vs.1.8 ng/µl FI, P = 0.0409; in d) 50% FH: 0 FI vs. 0.9, 1.8 ng/µl FI, P = 0.0381; in (e) 25% FH: 0 FI vs. 0.9 ng/µl FI, P = 0.0133, 0 FI vs. 1.8 ng/µl FI, P < 0.0001; in (f) 50% FH: 0 FI vs. 0.4 ng/µl FI, P = 0.0286, 0 FI vs. 0.9, 1.8 ng/µl FI, P = 0.0095; and in (h) 50% FH: 0 FI vs. 1.8 ng/µl FI, P = 0.0381.
Fig. 4
Fig. 4
AP activation measured in purified protein reactions with 100% FI and increasing concentrations of FH and correlated with C3 inactivation. Levels of activation in reactions of purified proteins C3, FB, FD containing 100% FI (1.8 ng/µl) and increasing concentrations of FH (1.5–25 ng/µl) were measured by blot analysis. Graphs in (a-d) show individual values of (a) C3a; (b) Ba; (c) C3 inactivation; and (d) FB cleavage from the analysis of 4–16 reactions of each composition. The horizontal bars indicate the median. Statistical significance in (a-d) is shown for values (blue circles) compared to measurements in reactions without either FH or FI (red circles). In (a) C3a: 0 FH vs. 6.25 ng/µl FH, P = 0.0013, 0 FH vs. 12.5 FH, P = 0.0004, 0 FH vs. 25 ng/µl FH, P < 0.0001; in (b) Ba: 0 FH vs. 12.5 ng/µl FH, P = 0.0238, 0 FH vs. 25 ng/µl FH, P = 0.0031; in (c) C3 inactivation: 0 FH vs. 1.5 ng/µl FH, P < 0.0001; 0 FH vs. 3.1 ng/µl FH, P = 0.0257, 0 FH vs. 6.25 ng/µl FH, P < 0.0001, 0 FH vs. 12.5 ng/µl FH, P = 0.0003, 0 FH vs. 25 ng/µl FH, P < 0.0001; and in (d) FB cleavage: 0 FH vs. 12.5 ng/µl FH, P = 0.0104, 0 FH vs. 25 ng/µl FH, P < 0.0001. Correlation plots in (e-g) compare C3 inactivation with (e) C3a (blue circles); (f) Ba (green circles); and (g) FB cleavage (purple circles) measured in reactions of 1.8 ng/µl FI and decreasing concentrations of FH. In (h), C3 inactivation was compared to FB cleavage (dark blue circles) in reactions of 25 ng/µl FH and increasing concentrations of FI. Data in (e-h) (mean values measured in 4–8 reactions under each condition) was analyzed for interdependence using Pearson’s correlation coefficient (PCC). In (e) PCC = −0.9669, r2 = 0.9348, P = 0.0072, in (f) PCC = −0.9476, r2 = 0.8979, P = 0.0524; in (g) PCC = −0.955, r2 = 0.9120, P = 0.045; and in (h) PCC = −0.9875, r2 = 0.9751, P = 0.0017.
Fig. 5
Fig. 5
AP activation in either FI-D or FH-D serum with/without HFB addition. Activation products C3a and Ba were measured (by Western blotting) at 5 min intervals over 30 min in both depleted serum types in the presence and absence of HFB. Reactions were initiated at time = 0 by the addition of 5 mM Mg+2 ions. The HFB concentration (30 ng/µl) was 2.4-fold higher than the FB levels in both depleted serum types. Graphs show comparison levels of: (a) C3a in FI-D and FH-D serum alone, (b) Ba in FI-D and FH-D serum alone, (c) C3a in FI-D serum ± HFB, (d) Ba in FI-D serum ± HFB, (e) C3a in FH-D serum ± HFB; and (f) Ba in FH-D serum ± HFB. Each graph shows individual values measured in: FI-D serum (blue circles); FI-D serum + HFB (green triangles); FH-D serum (red squares); and FH-D serum + HFB (brown squares). Horizontal bars indicate the median value from 3–7 measurements for each experimental condition. Statistical significance in (a) 5 min FI-D serum vs. 5 min FH-D serum, P = 0.0012; FH-D serum, 0 min vs. 5 min, P = 0.0022, 0 min vs. 10, 15, 20 min, P = 0.0238; (b) FI-D serum, 0 min vs. 5 min, P = 0.0379, FI-D vs. FH-D at 0 min, P = 0.0099, FH-D serum, 0 min vs. 5 min, P = 0.0006, 0 min vs. 10–30 min, P = 0.0083; (d) FI-D serum, 0 min vs. 5 min, P = 0.0379 and FI-D + HFB, 0 min vs. 5 min, P = 0.0286; (e) FH-D serum, 0 min vs. 5 min, P = 0.0022, 0 min vs. 10, 15, 20 min, P = 0.0238 and FH-D + HFB, 0 min vs. 5 min, P = 0.0286; and (f) FH-D serum, 0 min vs. 5 min, P = 0.0006, 0 min vs. 10–30 min, P = 0.0083; and FH-D + HFB, 0 min vs. 5 min, P = 0.0286.
Fig. 6
Fig. 6
AP activation in FI-D serum and FH-D serum with addition of each depleted protein. The extent of FB cleavage and production of C3a and Ba were measured (by Western blot analysis) in both types of depleted serum after addition of 100% of the relevant depleted protein. Graphs of C3a levels in: (a) FI-D serum ± 1.8 ng/µl FI (100%) and (b) FH-D serum ± 25 ng/µl FH (100%). Graphs of Ba levels in: (c) FI-D serum ± 1.8 ng/µl FI (100%) and (d) FH-D serum ± 25 ng/µl FH (100%). Graphs showing the extent of FB cleavage in: (e) FI-D serum ± 1.8 ng/µl FI (100%) and (f) FH-D serum ± 25 ng/µl FH (100%). Individual values are shown for depleted serum values alone (red circles) and FI-D serum plus 100% FI or FH-D serum plus 100% FH (blue circles). Horizontal bars indicate the median value and statistical significance is shown for values compared to measured values in reactions as noted. N = 4 for each experimental condition. In (a) FI-D serum, 0 min vs. 10 min, P = 0.0286; (b) FH-D serum, 0 min vs. 5, 10 min, P = 0.0286 and FH-D at 5 min vs. FH-D + FH at 5 min, P = 0.0286; (d) FH-D serum, 0 min vs. each time point, P = 0.0286 and FH-D at 5 min vs. FH-D + FH at 5 min, P = 0.0286; (e) FI-D serum, 0 min vs. each time point, P = 0.0286; FI-D + FI, 0 min vs. each time point, P = 0.0286 and FI-D at 15 min vs. FI-D + FI at 15 min, P = 0.0286; and (f) FH-D serum, 0 min vs. each time point, P = 0.0286, there were no significant differences in FH-D + FH at 0 min vs. each time point, and FH-D vs. FH-D + FH, at each time point except time = 0, P = 0.0286.

References

    1. Pangburn, M. K. & Müller-Eberhard, H. J. Kinetic and thermodynamic analysis of the control of C3b by the complement regulatory proteins factors H and I. Biochemistry22, 178–185 (1983). - PubMed
    1. Pangburn, M. K., Pangburn, K. L., Koistinen, V., Meri, S. & Sharma, A. K. Molecular mechanisms of target recognition in an innate immune system: interactions among factor H, C3b, and target in the alternative pathway of human complement. J. Immunol.164, 4742–4751 (2000). - PubMed
    1. Pangburn, M. K. & Muller-Eberhard, H. J. Relation of putative thioester bond in C3 to activation of the alternative pathway and the binding of C3b to biological targets of complement. J. Exp. Med.152, 1102–1114 (1980). - PMC - PubMed
    1. Schreiber, R. D., Pangburn, M. K., Lesavre, P. H. & Müller-Eberhard, H. J. Initiation of the alternative pathway of complement: recognition of activators by bound C3b and assembly of the entire pathway from six isolated proteins. PNAS75, 3948–3952 (1978). - PMC - PubMed
    1. Law, S. K. & Dodds, A. W. The internal thioester and the covalent binding properties of the complement proteins C3 and C4. Protein Sci.6, 263–274 (1997). - PMC - PubMed

MeSH terms

LinkOut - more resources