. 2025 Mar 29;8(1):520.
doi: 10.1038/s42003-025-07871-w.

Spatial transcriptomic profiling of the human fallopian tube epithelium reveals region-specific gene expression patterns

Affiliations

Spatial transcriptomic profiling of the human fallopian tube epithelium reveals region-specific gene expression patterns

Jared Sipes et al. Commun Biol. .

Abstract

The fallopian tube (FT) plays a crucial role in fertility, gynecological health, and high-grade serous ovarian cancer (HGSOC) development. Despite its importance, the spatial transcriptome of the FT's distinct anatomical regions (fimbria, infundibulum, ampulla, and isthmus) remains underexplored. Using the GeoMx Digital Spatial Profiler (DSP) and a targeted ~1800 gene panel, we analyze premenopausal FT epithelium, identifying region-specific gene expression patterns. Our analysis reveals upregulation of mature ciliated cell markers (FOXJ1, MLF1, SPA17, and CTSS) approaching the fimbria, elevated ROS and apoptosis-related transcripts (TXNIP, PRDX5, BAD, GAS1) in the distal FT, and a switch in cell-cell adhesion transcripts (CDH1, CDH3) along the distal-to-proximal axis. We also provide evidence that MHC-II transcripts in the FT are differentially regulated throughout the menstrual cycle, with lower expression in follicular phase. These results suggest spatially regulated expression of FT transcripts with implications for fertilization and early neoplastic changes contributing to HGSOC.


Conflict of interest statement

Competing interests: A.K.G. is a co-founder of Sinochips Diagnostics, serves as a scientific advisory board member to Biovica, Clara Biotech, and Sinochips Diagnostics, and receives research funding from Predicine and VITRAC Therapeutics. The other authors report no conflict of interest.

Figures

Fig. 1
Fig. 1. Experimental design.
a Anatomy of the fallopian tube, showing the four major anatomical regions and major cell types. The transcription factors PAX8 and FOXJ1 are used to distinguish secretory and ciliated cells. b Experimental workflow, showing creation of discovery (n = 3) and validation (n = 4) cohorts. Following dissection into anatomical regions, regions of interest (ROIs) containing epithelial cells were selected, segmented by cell type, and probe barcodes were collected from each segment. Barcodes were sequenced on the Illumina NextSeq550, and the final output was transcript abundance for all transcripts in the ~1800-gene CTA panel. c–f Representative scans of the fimbria, infundibulum, ampulla, and isthmus from patient 2, showing staining and ROI selection. Nuclei (blue) = SYTO13; FOXJ1 expressing ciliated cells (green) = CY3, PAX8 expressing secretory cells (red) = AF594; Scale bar = 5 mm. g A Sankey diagram showing distribution of segments in the discovery and validation datasets across three categories: patient of origin, anatomical region (Amp = Ampulla (red), Fim = Fimbria (green), Inf = Infundibulum (blue), Isth = Isthmus (purple)), and cell type (ciliated or secretory). A total of 77 segments (out of 110 originally collected) remain following quality control. h Boxplot showing expression of FOXJ1 and PAX8 in ciliated and secretory segments for discovery (n = 77 segments) and validation (n = 74 segments) datasets. Ciliated = green, Secretory = red; Lower and upper hinges of boxplot correspond to first (Q1) and third quartiles (Q3); central line corresponds to median. Whiskers of boxplot range from Q3 + 1.5*IQR to Q1-1.5*IQR. P-values calculated using two-sided t-test. Created in BioRender. Sipes, J. (2025) https://BioRender.com/a22y908.
Fig. 2
Fig. 2. Regional comparison volcano plots showing transcripts upregulated and downregulated in secretory and ciliated ROIs in the discovery cohort.
Volcano plots for secretory cell segments showing transcripts differentially expressed in (a) the fimbria, (b) the infundibulum, (c) the ampulla, and (d) the isthmus relative to all other regions. e) A summary of all transcripts observed upregulated and downregulated in the fallopian tube. Scale bar = 5 mm f) A summary of all transcripts observed upregulated and downregulated in ciliated cells. Scale bar = 5 mm g-j) Volcano plots for ciliated cell segments showing transcripts differentially expressed in (g) the fimbria, (h) the infundibulum, (i) the ampulla, and (j) the isthmus relative to all over regions. Red points: upregulated transcripts; blue points: downregulated transcripts, red lines: p-value cutoff (log10(p)=1.3); blue lines = FC cutoff (log2(FC)=+/0.5). Created in BioRender. Sipes, J. (2025) https://BioRender.com/p37o480.
Fig. 3
Fig. 3. Markers of mature ciliated cells are enriched approaching the fimbria.
a Diagram showing differential expression of markers of mature ciliated cells along the fallopian tube. Volcano plots comparing expression of transcripts between fimbria and isthmus sections in the discovery (b) and validation (c) cohorts, with mature ciliated cell markers highlighted in green. Red lines: p-value cutoff (log10(p)=1.3); blue lines = FC cutoff (log2(FC)=+/0.5). All p-values are calculated using t-test.) d Boxplot showing ratio of FOXJ1:PAX8 ratio in ciliated cells (discovery cohort, n = 35). e Boxplot showing PAX8:FOXJ1 ratio in secretory cells (discovery cohort, n = 42). Boxplots showing expression of mature ciliated cell markers MLF1 (f), SPA17 (g), CTSS (h), and C6 (i) in ciliated and secretory segments (discovery cohort). j-o Boxplots plotting the same ratios or gene expression changes as (d-i), but for the validation cohort (n = 36 ciliated and n = 38 secretory segments). Respectively, PAX8:FOXJ1 ratio in ciliated cells (j), PAX8:FOXJ1 ratio in secretory cells (k), MLF1 expression (l), SPA17 expression (m), CTSS expression (n), and C6 expression (o). Lower and upper hinges of boxplot correspond to first (Q1) and third quartiles (Q3); central line corresponds to median. Whiskers of all boxplots range from Q3 + 1.5×IQR to Q1-1.5×IQR. All p-values calculated using two-sided t-test. Created in BioRender. Sipes, J. (2025) https://BioRender.com/p37o480.
Fig. 4
Fig. 4. Differential expression of transcripts involved in cell-cell adhesion, ROS response, and apoptosis.
a–p Boxplots of transcripts differentially expressed in different anatomical regions of the fallopian tube, showing expression in both ciliated and secretory segments. Point shapes are chosen based on patient information. P-values for selected comparisons are plotted. All p-values are calculated using two-sided t-test. green: fimbria; blue: infundibulum, red: ampulla, purple: isthmus; circles: pt_1, squares: pt_2, diamonds: pt_3, Lower and upper hinges of boxplot correspond to first (Q1) and third quartiles (Q3); central line corresponds to median. Whiskers of boxplot range from Q3 + 1.5*IQR to Q1-1.5*IQR. Plots (a–h) show cell-cell adhesion transcripts expressed in the fallopian tube epithelium in the discovery (n = 77) (a–d) and validation cohorts (n = 74) (e–h). Plots (i–p) show transcripts associated with reactive oxygen species or apoptosis/cell cycle expressed in the fallopian tube epithelium in the discovery (i–l) and validation cohorts (m–p).
Fig. 5
Fig. 5. Differential expression of MHC-II and related transcripts.
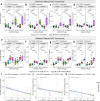
a-d Boxplots of MHCII transcripts differentially expressed in the discovery cohort (n = 77 segments). HLA-DRA, HLA-DRB, c HLA-DPA1, HLA-DQA1. e-h) Boxplots of MHCII transcripts differentially expressed in the validation cohort (n = 74 segments): HLA-DRA, HLA-DRB, g HLA-DPA1, h HLA-DQA1. All p-values are calculated using two-sided t-test. Green: fimbria; blue: infundibulum, red: ampulla, purple: isthmus; circles: pt_1, squares: pt_2, diamonds: pt_3, Lower and upper hinges of boxplot correspond to first (Q1) and third quartiles (Q3); central line corresponds to median. Whiskers of boxplot range from Q3 + 1.5 × IQR to Q1 - 1.5 × IQR. Scatterplots comparing HLA-DRA, HLA-DPA1, or HLA-DQA1 expression to percentage of OVGP1 positive cells in equivalent IHC stained slides. Pearson’s correlation coefficient (R) and associated p-value are shown on scatterplots (calculated using the R package ‘ggpubr‘). Grey border around the line of best fit shows the 95% confidence interval.
Fig. 6
Fig. 6. Schematic representation of cell-type distribution along the fallopian tube.
a Spatial transcriptomics profiling shows that the proportion of mature ciliated cells (green line) increases approaching the isthmus. CDH1 (E-cadherin) increases approaching the fimbria, while CDH3 (P-cadherin) expression increases approaching the isthmus. Created in BioRender. Sipes, J. (2025) https://BioRender.com/f36o257. The fallopian tube undergoes a shift in peg cell (OVGP1 + ) distribution in timing with the ovulatory cycle. Pre-ovulation (follicular/proliferative phase), OVGP1 is upregulated, while MHC-II associated genes are suppressed, with the strongest effect in the central fallopian tube (infundibulum/ampulla). Post-ovulation (luteal/secretory), peg cells revert to normal secretory cells, and MHC-II genes return to a higher expression throughout the fallopian tube, with the isthmus showing the highest overall expression. MHC-II transcripts (blue, dotted line) show an increase approaching the isthmus. Dark green cell with cilia = mature ciliated cells; light green cell with cilia = immature/transitional ciliated cells. Created in BioRender. Sipes, J. (2025) https://BioRender.com/k86a54.

References

    1. Briceag, I. et al. Fallopian tubes–literature review of anatomy and etiology in female infertility. J. Med Life8, 129–131 (2015). - PMC - PubMed
    1. Miller, J. H., Weinberg, R. K., Canino, N. L., Klein, N. A. & Soules, M. R. The pattern of infertility diagnoses in women of advanced reproductive age. Am. J. Obstet. Gynecol.181, 952–957 (1999). - PubMed
    1. Ferlay, J. et al. Cancer incidence and mortality worldwide: Sources, methods and major patterns in GLOBOCAN 2012. Int. J. Cancer136, E359–E386 (2015). - PubMed
    1. Medeiros, F. et al. The Tubal Fimbria Is a Preferred Site for Early Adenocarcinoma in Women With Familial Ovarian Cancer Syndrome. Am. J. Surgical Pathol.30, 230–236 (2006). - PubMed
    1. Lee, Y. et al. A candidate precursor to serous carcinoma that originates in the distal fallopian tube. J. Pathol.211, 26–35 (2007). - PubMed

LinkOut - more resources