. 2025 Mar 29;26(1):312.
doi: 10.1186/s12864-025-11526-9.

Integrative analysis of transcriptome and metabolism reveals functional roles of redox homeostasis in low light and salt combined stress in Leymus chinensis

Affiliations

Integrative analysis of transcriptome and metabolism reveals functional roles of redox homeostasis in low light and salt combined stress in Leymus chinensis

Jikai Li et al. BMC Genomics. .

Abstract

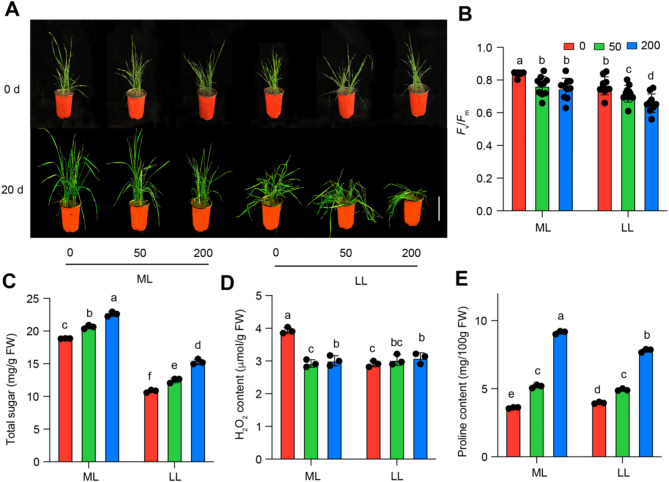
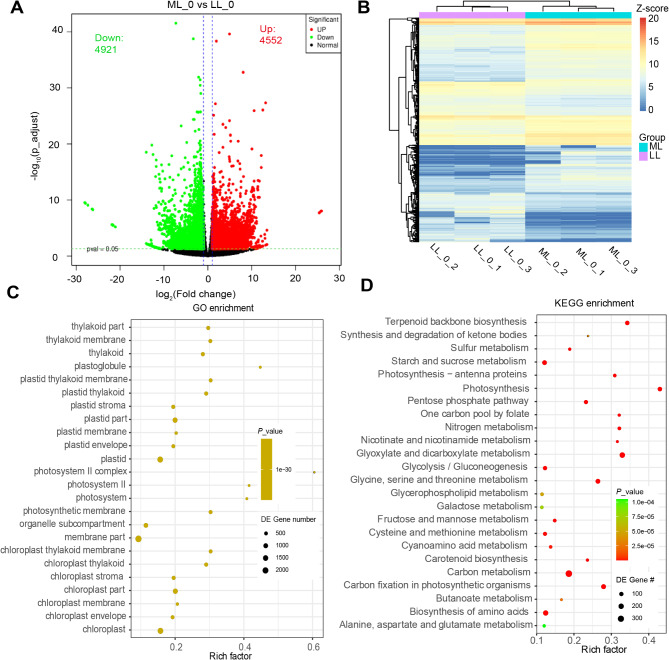
Salt stress is one of the major limiting factors of Leymus chinensis (named sheepgrass) growth, which accelerates inhibitive effects that are particularly concomitant with low light regimes (LL-Salt). However, little is known about physiological and molecular mechanisms under such LL-Salt in sheepgrass. This study aims to uncover the key reprogrammed metabolic pathways induced by LL-Salt through an integrated analysis of transcriptome and metabolism. Results suggested that the growth of sheepgrass seedlings was dramatically inhibited with a ranging of 8 to 20% reduction in Fv/Fm in LL-Salt combined treatments. Catalase activities were increased by 40% in LL but significantly decreased in salt stress, ranging from 15 to 46%. Both transcriptome and metabolism analysis reveal that carbon metabolism pathways were significantly enriched in the differentially expressed genes with downregulation by both LL and salt stress treatment. Metabolites involved in the photorespiration pathway, including serine and glycolate, were downregulated in LL while upregulated in salt stress treatment, with the same pattern of expression levels of a photorespiration regulatory gene, glycolate oxidase. Collectively, we found that serval antioxidant redox pathways, including photorespiration, GSG/GSSH redox, and ABA signaling, participated in response to LL and salt combined events and highlighted the roles of cellular redox homeostasis in LL-Salt response in sheepgrass.

Keywords: Antioxidant; Carbon metabolism; Photorespiration; ROS; Sheepgrass; TCA; Transcriptome.


Conflict of interest statement

Declarations. Ethics approval and consent to participate: Our rice collection work complies with the laws of the People’s Republic of China and has a permission letter from the Institute of Grass Research, Heilongjiang Academy of Agricultural Sciences. Voucher specimens were identified by Prof. Wei Li (Heilongjiang Academy of Agricultural Sciences) and kept at Heilongjiang Rice Quality Improvement and Genetic Breeding Engineering Research Center (No: SG001-SG058). All methods were carried out in accordance with relevant guidelines and regulations. Consent for publication: Not applicable. Competing interests: The authors declare no competing interests.

Figures

Fig. 1
Fig. 1
Performance of sheepgrass seedlings exposed to LL-Salt condition. A, Images of sheepgrass plants exposed to LL-Salt condition for 0 and 20 days. The vertical bar represents 5 cm. B-E, Fv/Fm, total sugar content, H2O2 content, and proline content. Each bar data represents the mean of replicates (n = 10 for panel B and n = 4 for panels C-E). Different letters represent significant differences based on one-way ANOVA followed by Tukey’s HSD tests (P < 0.01)
Fig. 2
Fig. 2
Transcriptome analysis on the grass exposed to either LL or high salt treatment. A, Principal component analysis on the global gene expression of sheepgrass leaves exposed to three salt treatments under ML. B, Heatmap representing the relative abundance of the global gene in 18 samples. C, Annotated information of biological pathways of the global gene
Fig. 3
Fig. 3
Low light-induced global expression changes in the grass. A, Volcano plot represents the differentially expressed genes compared to ML_0 and LL_0. B, heatmap showing the relative abundances of transcripts in six sheepgrass samples exposed to either LL or ML. C-D, GO (C), and KEGG (D) analysis on the list of downregulated DEGs in LL_0 compared it to ML_0
Fig. 4
Fig. 4
Salt-induced global gene expression changes in sheepgrass. A Venn diagram shows the common differentially expressed genes in comparing two salt treatments (ML_200 vs. ML_0 and ML_50 vs. ML_0). B, Summary of differentially expressed genes with either upregulated or downregulated patterns in comparing two salt treatments. C-D, GO (C), and KEGG (D) analysis on the list of downregulated DEGs in both salt treatments (ML_200 and ML_50) relative to ML_0
Fig. 5
Fig. 5
Interactive effects of salt and light on global gene expression in sheepgrass based on transcriptome analysis. A, Venn diagram showing the overlapped genes in comparisons of light (ML_0 vs. LL_0) and two salt treatments (ML_200 vs. ML_0 and ML_50 vs. ML_0). B, The relative abundance of the overlapped 18 genes. C-G, Relative expression levels of genes involved in the overlapped gene list in sheepgrass leaves exposed to light or salt treatment. Each bar data represents the mean of replicates (n = 3). Different letters represent significant differences based on one-way ANOVA followed by Tukey’s HSD tests (P < 0.05)
Fig. 6
Fig. 6
Differentially abundant metabolites in sheepgrass exposed to either salt or light conditions. A, Principal component analysis on the 1,254 identified metabolites of sheepgrass leaves exposed to three salt treatments under ML. B, Volcano plot represents the differentially abundant metabolites compared to ML_0 vs. LL_0. C, Venn diagram showing the overlapped differentially abundant metabolites in two salt treatments (ML_200 vs. ML_0 and ML_50 vs. ML_0). D-E, KEGG analysis on the list of differentially abundant metabolites compared to ML_200 vs. ML_0 and two salt treatments (ML_200 vs. ML_0 and ML_50 vs. ML_0)
Fig. 7
Fig. 7
Summary of the key metabolic pathways in low light and salt stress response in sheepgrass. A, Venn diagram of differentially abundant metabolites in comparisons of salt and light treatments. B, Heatmap representing the relative abundance of overlapped differentially abundant metabolites in comparisons of light (ML_0 vs. LL_0) and salt (ML_200 vs. ML_0 & ML_50 vs. ML_0). C-E, Relative expression levels of genes involved in ABA signaling pathway, photorespiration, and GSH/GSSG redox system pathways in sheepgrass leaves exposed to either LL or salt treatments. F, Summary of regulation pattern of key metabolic pathways in response to low light and salt stress in sheepgrass leaves. G, Working model showing the interactive effects of LL and salt on key metabolic pathways in sheepgrass leaves

References

    1. Panigrahy M, Majeed N, Panigrahi KC. Low-light and its effects on crop yield: genetic and genomic implications. J Biosci. 2020;45(1):102. - PubMed
    1. Li T, Tang S, Li W, Zhang S, Wang J, Pan D, Lin Z, Ma X, Chang Y, Liu B. Genome evolution and initial breeding of the triticeae grass Leymus chinensis dominating the Eurasian steppe. Proc Natl Acad Sci. 2023;120(44):e2308984120. - PMC - PubMed
    1. Peng X, Ma X, Fan W, Su M, Cheng L, Iftekhar A, et al. Improved drought and salt tolerance of Arabidopsis thaliana by transgenic expression of a novel DREB gene from Leymus chinensis. Plant Cell Rep. 2011;30:1493–1502. - PubMed
    1. Munns R, Tester M. Mechanisms of salinity tolerance. Annu Rev Plant Biol. 2008;59(1):651–81. - PubMed
    1. Hasanuzzaman M, Nahar K, Anee TI, Fujita M. Glutathione in plants: biosynthesis and physiological role in environmental stress tolerance. Physiol Mol Biology Plants. 2017;23:249–68. - PMC - PubMed

LinkOut - more resources