Multicenter Study
. 2025 Jun 23;46(24):2336-2347.
doi: 10.1093/eurheartj/ehaf131.

Deep learning-quantified body composition from positron emission tomography/computed tomography and cardiovascular outcomes: a multicentre study

Affiliations
Multicenter Study

Deep learning-quantified body composition from positron emission tomography/computed tomography and cardiovascular outcomes: a multicentre study

Robert J H Miller et al. Eur Heart J. .

Abstract

Background and aims: Positron emission tomography (PET)/computed tomography (CT) myocardial perfusion imaging (MPI) is a vital diagnostic tool, especially in patients with cardiometabolic syndrome. Low-dose CT scans are routinely performed with PET for attenuation correction and potentially contain valuable data about body tissue composition. Deep learning and image processing were combined to automatically quantify skeletal muscle (SM), bone and adipose tissue from these scans and then evaluate their associations with death or myocardial infarction (MI).

Methods: In PET MPI from three sites, deep learning quantified SM, bone, epicardial adipose tissue (EAT), subcutaneous adipose tissue (SAT), visceral adipose tissue (VAT), and intermuscular adipose tissue (IMAT). Sex-specific thresholds for abnormal values were established. Associations with death or MI were evaluated using unadjusted and multivariable models adjusted for clinical and imaging factors.

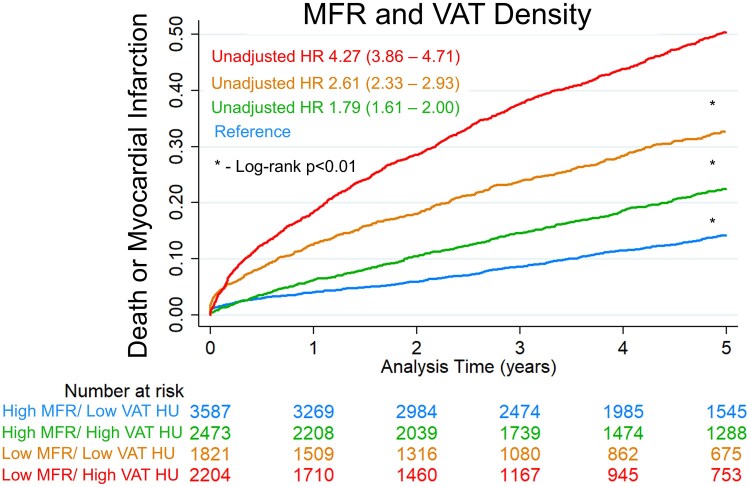
Results: This study included 10 085 patients, with median age 68 (interquartile range 59-76) and 5767 (57%) male. Body tissue segmentations were completed in 102 ± 4 s. Higher VAT density was associated with an increased risk of death or MI in both unadjusted [hazard ratio (HR) 1.40, 95% confidence interval (CI) 1.37-1.43] and adjusted (HR 1.24, 95% CI 1.19-1.28) analyses, with similar findings for IMAT, SAT, and EAT. Patients with elevated VAT density and reduced myocardial flow reserve had a significantly increased risk of death or MI (adjusted HR 2.49, 95% CI 2.23-2.77).

Conclusions: Volumetric body tissue composition can be obtained rapidly and automatically from standard cardiac PET/CT. This new information provides a detailed, quantitative assessment of sarcopenia and cardiometabolic health for physicians.

Keywords: Body composition; Deep learning; Positron emission tomography; Risk Stratification.


Figures

Structured Graphical Abstract
Overview of the study design. Automated body tissue segmentation of computed tomography (CT) attenuation scans by deep learning. This study evaluated correlations between variables and associations with outcomes. MFR, myocardial flow reserve; PET, positron emission tomography; VAT, visceral adipose tissue.
Figure 1
Figure 1
Sex-specific thresholds for abnormal indexed volumes and density. Skeletal muscle and bone volume and density were associated with lower risk above threshold. Subcutaneous adipose tissue (AT) volume above threshold was associated with reduced risk, while density above threshold was associated with increased risk. Volume or density above threshold was associated with increased risk for epicardial, intermuscular, and visceral AT. Examples of cases with low risk (top) and high-risk metrics (bottom). Segmentations are shown in an overlay. Skeletal muscle is shown in light brown, subcutaneous adipose tissue in light blue, epicardial adipose tissue in dark blue, intermuscular adipose tissue in dark brown, and visceral adipose tissue in green. AT, adipose tissue; HU, Hounsfield units
Figure 2
Figure 2
Unadjusted Kaplan–Meier curves as a function of visceral adipose tissue (VAT) density and skeletal muscle (SM) volume index. Hazard ratios (HRs) with 95% confidence intervals are shown. MI, myocardial infarction
Figure 3
Figure 3
Unadjusted Kaplan–Meier curves as a function of myocardial flow reserve (MFR) and visceral adipose tissue (VAT) density. Abnormal MFR was defined as <2. Abnormal VAT density was based on sex-specific thresholds defined above. Hazard ratios (HRs) with 95% confidence intervals are shown. HU, Hounsfield units
Figure 4
Figure 4
Unadjusted Kaplan–Meier survival curves for death or myocardial infarction (MI). Patients were classified according to skeletal muscle (SM) and subcutaneous adipose tissue (SAT) volume and density. Hazard ratios (HRs) with 95% confidence intervals are shown
Figure 5
Figure 5
Adjusted associations with death or myocardial infarction (MI) in the multivariable model incorporating segmentations as continuous variables. Adjusted hazard ratios shown in red if significant and grey if non-significant. The hazard ratios for continuous variables are expressed as per standard deviation increase in value. Confidence intervals in blue. BMI, body mass index; CAC, coronary artery calcium; EAT, epicardial adipose tissue; IMAT, intermuscular adipose tissue; LVEF, left ventricular ejection fraction; MFR, myocardial flow reserve; SAT, subcutaneous adipose tissue; SM, skeletal muscle; TPD, total perfusion deficit; VAT, visceral adipose tissue

References

    1. Knuuti J, Wijns W, Saraste A, Capodanno D, Barbato E, Funck-Brentano C, et al. 2019 ESC Guidelines for the diagnosis and management of chronic coronary syndromes. Eur Heart J 2019;41:407–77. 10.1093/eurheartj/ehz425 - DOI - PubMed
    1. Schindler TH, Fearon WF, Pelletier-Galarneau M, Ambrosio G, Sechtem U, Ruddy TD, et al. Myocardial perfusion PET for the detection and reporting of coronary microvascular dysfunction. JACC Cardiovasc Imaging 2023;16:536–48. 10.1016/j.jcmg.2022.12.015 - DOI - PubMed
    1. Murthy VL, Bateman TM, Beanlands RS, Berman DS, Borges-Neto S, Chareonthaitawee P, et al. Clinical quantification of myocardial blood flow using PET. J Nucl Med 2018;59:273–93. 10.2967/jnumed.117.201368 - DOI - PubMed
    1. Patel KK, Spertus JA, Chan PS, Sperry BW, Al Badarin F, Kennedy KF, et al. Myocardial blood flow reserve assessed by positron emission tomography myocardial perfusion imaging identifies patients with a survival benefit from early revascularization. Eur Heart J 2020;41:759–68. 10.1093/eurheartj/ehz389 - DOI - PMC - PubMed
    1. Thomas M, Sperry BW, Peri-Okonny P, Malik AO, McGhie AI, Saeed IM, et al. Relative prognostic significance of positron emission tomography myocardial perfusion imaging markers in cardiomyopathy. Circ Cardiovasc Imaging 2021;14:e012426. 10.1161/CIRCIMAGING.121.012426 - DOI - PMC - PubMed

Publication types